Troubleshooting
Getting Packet Viewer working in your application should be straightforward, but a few common configuration issues can cause some frustrating problems. Try these solutions for the most frequent integration issues and if you’re still running into issues please contact support@qacafe.com, we’re happy to help!
Diagnostic steps
Before troubleshooting a specific solution below, try these steps:
- Open your browser’s developer console (F12)
- Check the Network tab for failed requests to your API endpoint
- Look for any red error messages in the Console tab
- Note the exact error messages - they’ll guide you to the right solution below
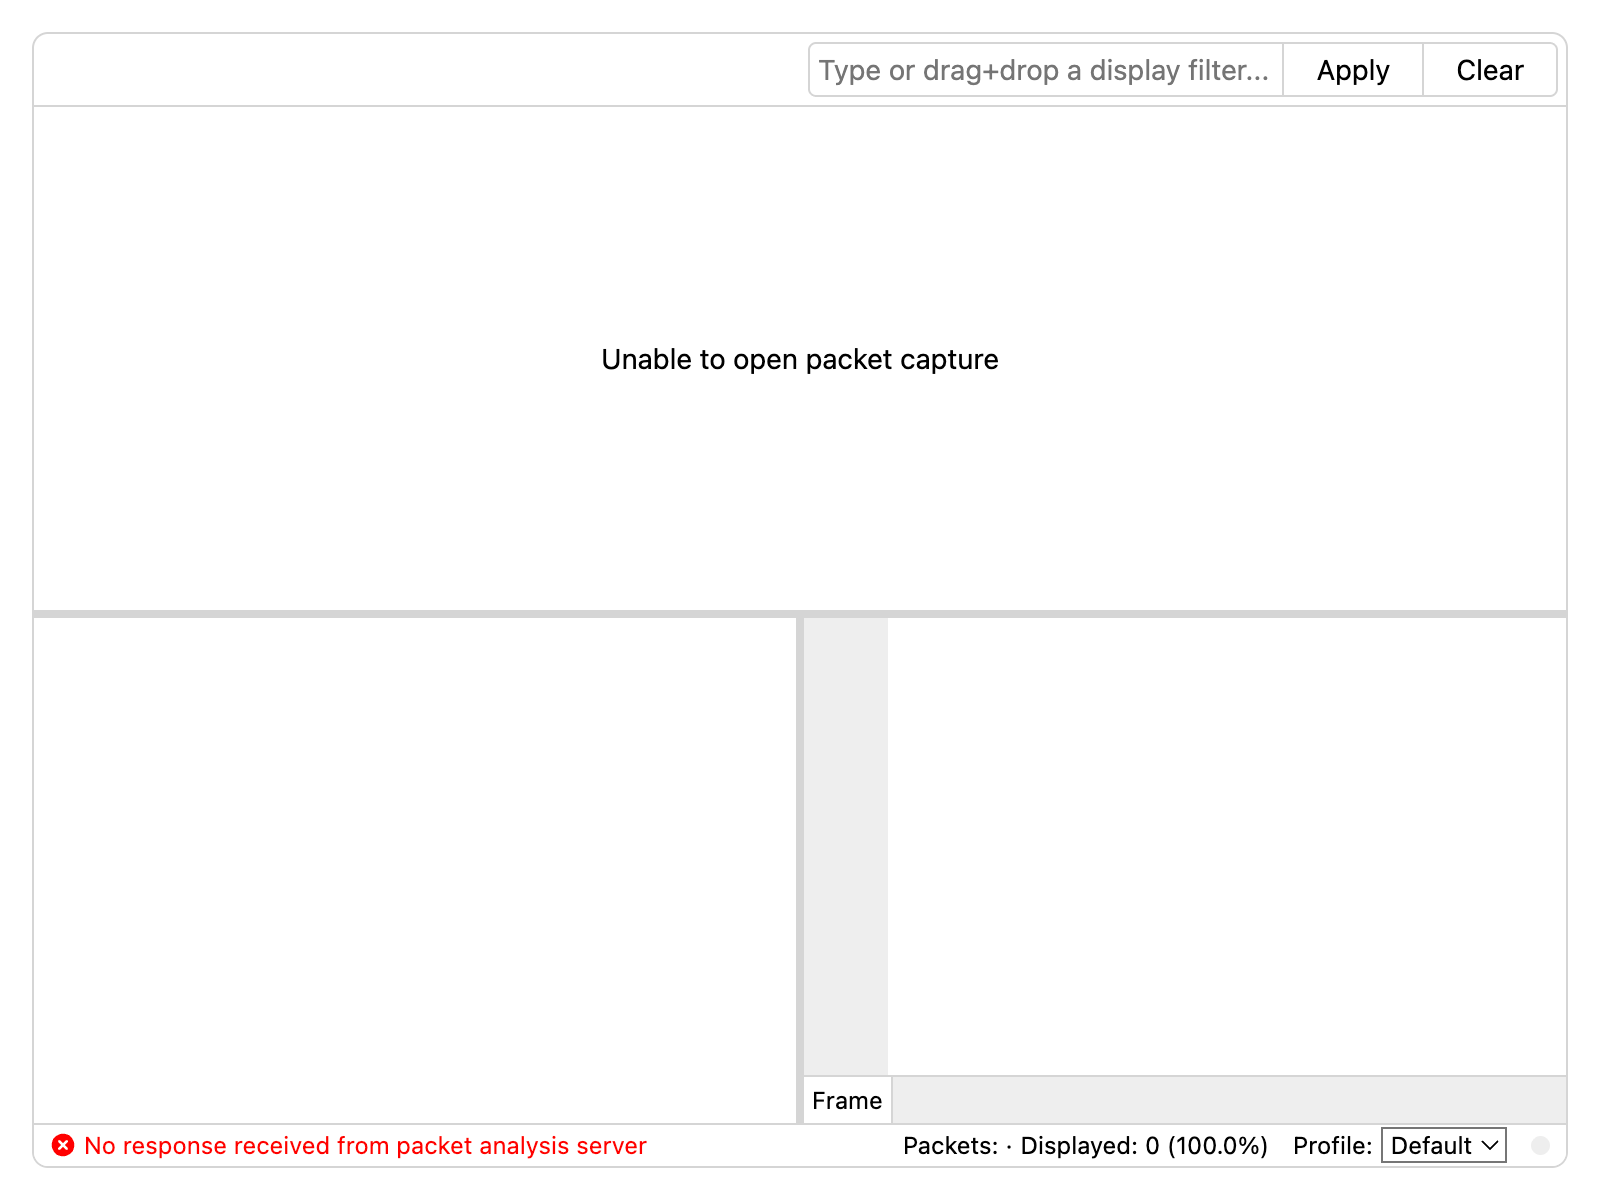
No response received from packet analysis server
If the Packet Viewer status bar displays No response received from packet analysis server, this indicates that the browser is unable to connect to the
API service.
Common issues that cause this include:
Most of these issues are commonly encountered during development or staging environments when the API service and the application are running on different domains.
In production, we strongly recommend running Packet Viewer behind a proxy from the same domain, which resolves most of these configuration challenges.
Endpoint Configuration
If the endpoint component prop is not
configured with the correct URI of the API service, opening the browser’s
developer console by pressing F12 will display HTTP 404 errors similar to the
following:

A common mistake is to forget the /api path when configuring this. For
example, if the API service is running on the host pv-api-server:8000, make
sure the endpoint is defined as https://pv-api-server:8000/api.
If you’re just getting started, or do not have the Docker set up yet, you can use the sample API server from our Quick Start Guide.
Cross-origin resource sharing (CORS)
After verifying that the endpoint is configured correctly above, if the
status bar still displays No response received from packet analysis server,
open the browser’s developer console by pressing F12. When the API service is
running on a different host and Cross-origin resource sharing (CORS) has not
been configured, error messages similar to the following will be displayed.

Modern web browsers will make requests to the API service when it is running on a different host.
This is commonly encountered in development or staging environments where the frontend and API service run on different ports or domains. In this case, configure Cross-origin resource sharing (CORS) to allow the web browser to make requests to an API server on a different domain.
In production, deploying Packet Viewer behind a proxy so that your application and the API server are on the same domain, will avoid CORS issues entirely.
Content-Security-Policy
If your application has strict Content-Security-Policy (CSP) headers, they can
block Packet Viewer’s network requests without showing visible errors in the
status bar. To check if CSP is blocking the web browser’s request, open the
developer console by pressing F12 and look for CSP errors similar to the
following:

This can be resolved by updating your Content-Security-Policy headers to
Before:
<meta http-equiv="Content-Security-Policy" content="connect-src 'self';" />
After:
<meta http-equiv="Content-Security-Policy" content="connect-src 'self' http://pv-api-server:8000;" />
Running Packet Viewer in production behind a proxy should resolve any CSP issues, as all requests will come from the same origin.
Still Having Issues?
If none of these solutions work, you likely have a more complex configuration issue. When contacting support@qacafe.com, please include the following to help us diagnose your specific situation much faster:
- A screenshot of Packet Viewer
- Any browser developer console errors found by pressing
F12to open the (screenshot or copy/paste) - Your component configuration:
<PacketViewer
  endpoint="your-exact-url-here"
  file={yourFile}
/>
- How you’re running Packet Viewer (Docker command, deployment method, etc.)
- Your deployment setup (same domain, different subdomain, localhost, etc.)