Logging
The Packet Viewer service logs HTTP requests to stdout in
Combined Log Format
and application log messages to stderr in
JSON. This article describes the log
format and provides examples for viewing these logs with
jq.
To view the logs using Docker, first, use docker ps to determine which
container to view the logs from:
# docker ps
CONTAINER ID   IMAGE                  COMMAND                  CREATED         STATUS         PORTS             NAMES
6f02e9244a8e   packet-viewer:2025.1   "/pv-api --config-di…"   3 seconds ago   Up 2 seconds   80/tcp, 443/tcp   peaceful_easley
eb8eaf54e52d   packet-viewer:2025.1   "/pv-api --config-di…"   4 seconds ago   Up 3 seconds   80/tcp, 443/tcp   gracious_dewdney
542c21a1dc68   packet-viewer:2025.1   "/pv-api --config-di…"   6 seconds ago   Up 5 seconds   80/tcp, 443/tcp   charming_spence
The CONTAINER ID can then be used to view the logs from a container with the
command docker logs CONTAINER. Adding the -f flag to follow log output will
output new log messages as they are generated.
The Packet Viewer service can be run with the --debug flag to include
additional application log messages useful for debugging. Running Packet Viewer
with the --environment development flag to pretty print and colorize the
application logs.
HTTP Logs
HTTP Logs are output to stdout in
Combined Log Format.
These can be viewed by redirecting stderr to /dev/null:
# docker logs CONTAINER 2>/dev/null
192.168.65.1 - - [24/Apr/2024:14:46:45 +0000] "GET /api/profiles HTTP/1.1" 200 41 "" "curl/8.4.0"
192.168.65.1 - - [24/Apr/2024:14:47:38 +0000] "GET /api/status?file=capture.pcapng HTTP/1.1" 200 555 "" "curl/8.4.0"
192.168.65.1 - - [24/Apr/2024:14:48:15 +0000] "GET /api/packets/list?file=capture.pcapng&profile=&filter=&start=0&count=1000 HTTP/1.1" 200 136128 "" "curl/8.4.0"
192.168.65.1 - - [24/Apr/2024:14:48:38 +0000] "GET /api/packets/decode?file=capture.pcapng&profile=&frame=1 HTTP/1.1" 200 12595 "" "curl/8.4.0"
Application Logs
To output only the application logs in bash you can redirect stdout to
/dev/null and stderr to stdout using the following command:
# docker logs CONTAINER 2>&1 >/dev/null
Running the Packet viewer service with the --debug flag will enable debugging
and adding the flag --sharkd-debug will add additional logs related to the
sharkd process running inside the container.
jq Recipes
Below are recipes using jq to view the
application log messages output by Packet Viewer for common troubleshooting
tasks. In these examples the application logs have been saved to the file
packet-viewer.log by running the command docker logs 4db0204455ee 2> packet-viewer.log.
Simplified
To view the logs in a simple human readable format the following command can be used:
jq -r '. | "\(.time) \t \(.level) \t \(.msg) \(.session.file) \(.sharkd.session.file)"' packet-viewer.log | sed 's/null//g'
This will produce log messages similar to the following and is useful while scanning for errors and interesting log messages.:
2024-04-25T20:40:57.052713571Z   INFO    initializing new session large_file.pcapng
2024-04-25T20:41:22.64255706Z    INFO    processing request for file  /data/captures/large_file.pcapng
2024-04-25T20:41:23.219055689Z   INFO    sharkd idle timeout expired  /data/captures/test.pcap
2024-04-25T20:41:23.219132754Z   INFO    shutting down sharkd process  /data/captures/test.pcap
2024-04-25T20:41:23.223534916Z   INFO    shutting down sharkd  /data/captures/test.pcap
2024-04-25T20:41:23.22360832Z    INFO    sharkd has closed session, cleaning up test.pcap
Once you have found a log message you would like more information on you can use the timestamp and the following command:
jq '. | select(.time == "2024-04-25T20:40:57.052713571Z")' packet-viewer.log
Errors
Application log message have INFO, ERROR, WARN and DEBUG log levels. To
search for messages with the ERROR log level the following can be used:
jq '. | select(.level=="ERROR")' packet-viewer.log
Capture File
Log messages can be filtered by capture file which is useful when
troubleshooting a specific file. Note that the capture file test.pcap must be
replaced in two places below::
jq '. | select(.sharkd.session.file=="test.pcap" or .session.file=="test.pcap")' packet-viewer.log
API Endpoint
To troubleshoot a specific API endpoint you can filter the log messages by a specific endpoint. For example to troubleshoot loading a UDP stream the following example can be used:
jq '. | select(.request.url_path=="/api/follow/UDP")' packet-viewer.log
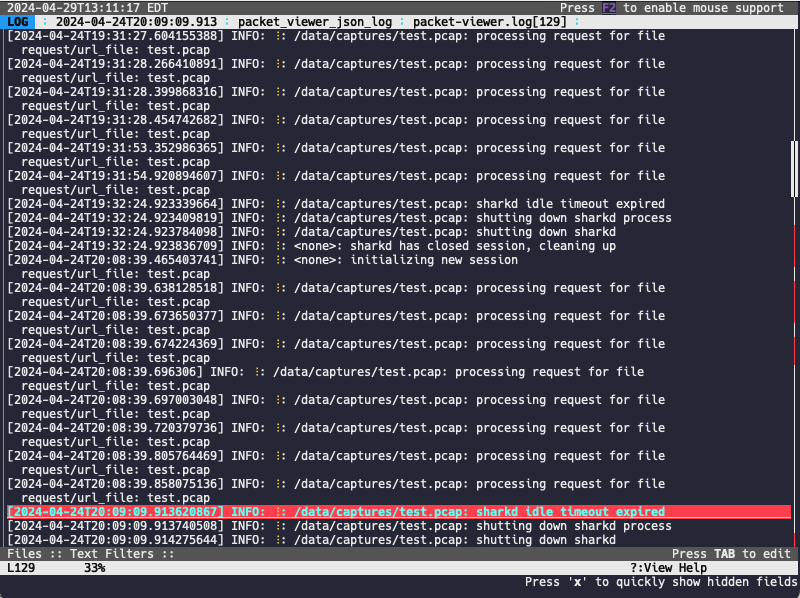
lnav
The Logfile Navigator is another tool that can be used to view the Packet Viewer application logs in a terminal window:

First, you will need to copy the log format below to a file named
packet-viewer.log, which can then be imported by runninglnav -i packet-viewer.log. Once that is done, the log file can be opened by running
lnav FILENAME. While viewing log files, press the p key to show and hide the
JSON fields in the log entry.
{
  "$schema": "https://lnav.org/schemas/format-v1.schema.json",
  "packet_viewer_json_log": {
    "title": "Packet Viewer log",
    "description": "Packet Viewer log format",
    "url": "https://www.qacafe.com/analysis-tools/packet-viewer",
    "json": true,
    "hide-extra": true,
    "level-field": "level",
    "level": {
      "error": 50,
      "warn": 40,
      "info": 30,
      "debug": 20
    },
    "line-format": [
      {
        "prefix": "[",
        "field": "__timestamp__",
        "suffix": "]"
      },
      " ",
      {
        "field": "level"
      },
      ": ",
      {
        "field": "source/function"
      },
      ": ",
      {
        "field": "sharkd/file",
        "default-value": "<none>"
      },
      ": ",
      {
        "field": "msg",
        "auto-width": true
      }
    ],
    "opid-field": "request/message_id",
    "value": {
      "config": {
        "kind": "json",
        "hidden": true
      },
      "memory/total": {
        "kind": "integer",
        "hidden": true
      },
      "level": {
        "kind": "string"
      },
      "license/customer": {
        "kind": "string",
        "hidden": true
      },
      "license/exp_date": {
        "kind": "string",
        "hidden": true
      },
      "msg": {
        "kind": "string"
      },
      "request/message_id": {
        "kind": "string",
        "identifier": true,
        "hidden": true
      },
      "request/method": {
        "kind": "string",
        "hidden": true
      },
      "request/remote_addr": {
        "kind": "string",
        "hidden": true
      },
      "request/remote_host": {
        "kind": "string",
        "hidden": true
      },
      "request/remote_port": {
        "kind": "string",
        "hidden": true
      },
      "request/url": {
        "kind": "string",
        "hidden": true
      },
      "request/url_path": {
        "kind": "string",
        "hidden": true
      },
      "request/url_file": {
        "kind": "string",
        "hidden": true
      },
      "request/url_profile": {
        "kind": "string",
        "hidden": true
      },
      "request/url_filter": {
        "kind": "string",
        "hidden": true
      },
      "service/sharkd_version": {
        "kind": "string",
        "hidden": true
      },
      "session/file": {
        "kind": "string",
        "hidden": true
      },
      "session/profile": {
        "kind": "string",
        "hidden": true
      },
      "session/url": {
        "kind": "string",
        "hidden": true
      },
      "sharkd/file": {
        "kind": "string"
      },
      "sharkd/profile": {
        "kind": "string",
        "hidden": true
      },
      "source/function": {
        "kind": "string",
        "identifier": true
      },
      "source/file": {
        "kind": "string",
        "identifier": true,
        "hidden": true
      },
      "source/line": {
        "kind": "integer",
        "identifier": true,
        "hidden": true
      },
      "version/string": {
        "kind": "string",
        "hidden": true
      },
      "version/version": {
        "kind": "string",
        "hidden": true
      },
      "version/revision": {
        "kind": "string",
        "hidden": true
      },
      "version/branch": {
        "kind": "string",
        "hidden": true
      },
      "version/tag": {
        "kind": "string",
        "hidden": true
      },
      "version/time": {
        "kind": "string",
        "hidden": true
      },
      "version/user": {
        "kind": "string",
        "hidden": true
      },
      "version/host": {
        "kind": "string",
        "hidden": true
      }
    },
    "body-field": "msg",
    "timestamp-field": "time"
  }
}