CDRouter Performance User Guide
Introduction
The CDRouter Performance expansion enhances traditional CDRouter functional testing by adding basic performance testing capabilities for TCP and UDP traffic over IPv4 and IPv6 (unicast and multicast) to CDRouter.
The CDRouter Performance expansion includes a number of throughput and latency test cases which are designed to measure the performance of application level traffic through a DUT. These tests can be combined with existing CDRouter functional tests to track the DUT’s behavior and performance over time.
CDRouter Performance enables:
- Download, upload, LAN-to-LAN, and bi-directional throughput tests for TCP and UDP traffic
- Control over transmit bandwidth rate and datagram size
- Control over the number of concurrent streams
- UDP, DNS query, and DHCP (renew and restart) latency tests
- Support for testing with up to 32 LAN clients simultaneously
- Support for both IPv4 and IPv6 unicast and multicast based traffic
- Support for Ethernet and 802.11 a/b/g/n/ac/ax/be wireless interfaces (see below)
- Support for testing with multiple DSCP markings
- Visualization tools that enable graphing of performance data over time
- Maximum performance rates of 10Gbps (10000 Mbps)
(Support for specific interface types varies by NTA1000 version)
Licensing
CDRouter Performance is a licensed expansion that must be purchased from QA Cafe. For more information please contact sales@qacafe.com.
System Requirements
The CDRouter Performance expansion requires an NTA1000v4 or newer system from QA Cafe. Some features also require the following expansions:
For more information about NTA1000 upgrade options please contact sales@qacafe.com.
Terminology
CDRouter Performance introduces a few concepts and terms that are defined below:
-
Application layer performance: The measurement of application layer traffic throughput and/or latency through a DUT. Application layer traffic specifically refers to network traffic that simulates data from OSI layers 4 through 7.
-
Application latency: The measurement of time it takes for an application to make a request and receive a response. Specifically, the amount of time between sending a request and receiving a reply.
-
Bandwidth: The maximum transmit or receive data rate for a particular physical interface, often defined in megabits per second (Mb/sec or Mbps). For example, Fast Ethernet has a bandwidth of 100 Mb/sec whereas Gigabit Ethernet has a bandwidth of 1,000 Mb/sec (1Gb/sec or 1Gbps). In the CDRouter Performance expansion, bandwidth is a configurable parameter that determines the maximum attempted transmit rate for a particular test.
-
Download test: A performance test that measures a performance metric in the downstream direction from WAN to LAN.
-
DUT: Device under test. This is the CPE or gateway device that is connected to, and being tested by CDRouter.
-
Goodput: This is a measure of the actual data that is sent or received. This is the raw application data, minus all frame/packet/segment headers. For example, a 1500-byte frame will have 1472 bytes of actual UDP data within it. This is also referred to as throughput and is measured in megabits per second (Mb/sec or Mbps).
-
LAN test: A performance test that measures a performance metric from one LAN client to a second LAN client. This would typically be used to measure either the switching or bridging capability of a DUT.
-
Mb/sec or Mbps: Megabits per second. This is a unit of measure for data transfer speed that is equivalent to one million bits per second. Most data transfer speed metrics in the CDRouter Performance expansion are presented in units of Mb/sec.
-
Retransmits: The total number of retransmitted TCP packets for a given performance test. Retransmits provide a basic measure of loss for TCP connections.
-
Upload test: A performance test that measures a performance metric in the upstream direction from LAN to WAN.
Test Methodology
Overview
Throughput (Goodput) Testing
The CDRouter Performance expansion uses a client-server model for sending and
receiving traffic, and then measuring performance. Setting the testvar
supportsPerformance to a value of yes enables performance
testing with CDRouter. When enabled, CDRouter will create a performance ‘server’
and a performance ‘client’, one on each interface (2) used in the test. For the
LAN-to-WAN performance test cases, the server is defined on the primary WAN
interface and the client is on the primary LAN interface. For the LAN-to-LAN
performance test cases, the server and client are each defined on their own LAN
interface (the primary and a secondary).
The performance server’s IPv4 and IPv6 addresses are specified by the testvars
perfWanIp and perfWanIpv6, respectively. The
performance client’s IP addresses on the LAN are assigned automatically using
either DHCP or static for IPv4, and DHCPv6 or autoconf for IPv6. For the
LAN-to-LAN test cases, both, the server and the client are allocated addresses
via the above method. The performance client supports being configured on either
a wired or wireless interface on the LAN.
When a performance test is run, a control connection is established between the performance client and server. Performance traffic is then transmitted in the upstream or downstream direction by the client or server, respectively. The received traffic is monitored and key performance metrics are then calculated. Bidirectional tests establish a second control connection between the server and client allowing performance traffic to be transmitted in both directions (upstream and downstream) simultaneously.
Configured Rate vs Fixed Rate Tests
CDRouter’s Performance expansion includes two types of throughput tests:
-
Configured rate tests: the direction, traffic type, and address family are hard-coded and defined by the test case. The transmit bandwidth, pass/fail threshold, and all other aspects of the test are defined by the user in the config file. All throughput tests not contained in the fixed-rate-perf* modules are configured rate tests.
-
Fixed rate tests: identical to a configured rate test except that the transmit bandwidth and pass/fail threshold are also hard-coded and defined by the test case. Only the tests in the fixed-rate-perf* modules are fixed rate tests.
The strategy and requirements of the user will determine which tests make the most sense.
Because configured rate tests require the user to define the transmit bandwidth and threshold in the config file, only a single target bandwidth can be verified per test run. However, configured rate tests provide fine-grained control that make it possible to precisely identify the maximum achievable throughput of a device in various user defined scenarios.
Configured rate tests may require the user to review the test log and/or config file to properly interpret the results. For example, if the bandwidth and threshold for a configured rate test are set to 500 and 20 Mbps, respectively, a passing result only indicates that the DUT’s throughput was between 20 and 500 Mbps. Without knowledge of the config file settings, nothing can be inferred directly The only way to determine the exact value achieved by the DUT and is to pull the reported value from the test log or view the performance graph.
Fixed rate tests set the transmit bandwidth and pass/fail threshold on a per test case basis. Multiple fixed rate tests are included in each fixed rate test module. This makes it possible to verify multiple target bandwidths in a single test run by simply including additional fixed rate tests for target bandwidths of interest.
Fixed rate tests require minimal configuration and the results are easy to interpret. For any given the test, the rate, direction, address family, and traffic type in the test name indicate exactly what type of traffic will be sent and at what bandwidth.
The threshold for all fixed rate tests is set to 95% of the bandwidth. A passing result for a 100 Mbps fixed rate test indicates that the DUT achieved a throughput of between 95 and 100 Mbps. A FAIL indicates that the DUT did not achieve a throughput of at least 95 Mbps. This can be inferred directly from the high level PASS/FAIL result for a test without having to review the test log.
Application Latency Testing
The methodology for application latency testing is similar to throughput testing. The main difference is that the performance server is replaced by a simulated remote host for the UDP latency tests and a simulated DNS server for the DNS latency tests. The DHCP tests are only between a LAN client and the DUT.
In these test cases, the appropriate protocol message is sent and the time is recorded. When the reply is received, the time is recorded again. The latency is the difference in time between the recorded times. In all cases, several attempts are made and the reported/validated latency is the average of all the times collected. The number of attempts is a configurable value.
Performance Metrics
Two key performance metrics, throughput and latency, are currently supported by the CDRouter Performance expansion. Loss (UDP) and retries (TCP) are also measured as part of the throughput tests:
-
Throughput: The total amount of network traffic received by the performance endpoint; the performance client in the downstream direction and the performance server in the upstream direction. Throughput is also referred to as ‘achieved bandwidth’ or ‘goodput’ and is measured in Mb/sec. This measurement is calculated using the application payload only and does not include packet headers. In the UDP tests, packets that arrive out of order are still counted when calculating throughput.
-
Loss: For upload tests, it is the difference between the number of UDP packets transmitted by the performance client and the number of UDP packets received by the performance server. For download tests, it is the difference between the number of UDP packets transmitted by the performance server and the number of UDP packets received by the performance client. In either case, UDP packets that arrive out of order are also counted as loss. Loss is expressed as a percentage.
-
Retries: For upload tests, this is the number of times the client had to retry sending the same TCP packet. For download tests, this is the number of times the server had to retry sending the same TCP packet. Retries typically give an indication of network congestion. In the case of a single device, it may indicate ‘congestion’ on the DUT itself.
-
Latency: For UDP, this is the amount of time it takes for a packet to travel between the performance client and performance server through the DUT and vice versa. For DHCP and DNS, this is the amount of time between sending a request and receiving a response. Latency is measured in microseconds (usec).
Test Cases
The CDRouter Performance expansion includes 14 test modules for verifying basic application layer performance for different traffic types over IPv4 and IPv6:
| Test Module | Description | Number of Tests | Other Licenses Required |
|---|---|---|---|
| fixed-dscp-perf-download | IPv4 fixed DSCP performance tests | 12 | – |
| fixed-dscp-perf-download-v6 | IPv6 fixed DSCP performance tests | 12 | IPv6 |
| fixed-dscp-perf-upload | IPv4 fixed DSCP performance tests | 12 | – |
| fixed-dscp-perf-upload-v6 | IPv6 fixed DSCP performance tests | 12 | IPv6 |
| fixed-rate-perf | IPv4 fixed rate performance tests, 0 to 1 Gbps | 192 | – |
| fixed-rate-perf-v6 | IPv6 fixed rate performance tests, 0 to 1 Gbps | 192 | IPv6 |
| fixed-rate-perf-2-5 | IPv4 fixed rate performance tests, 1 to 2.5 Gbps | 308 | – |
| fixed-rate-perf-2-5-v6 | IPv6 fixed rate performance tests, 1 to 2.5 Gbps | 308 | IPv6 |
| fixed-rate-perf-10 | IPv4 fixed rate performance tests, 2.5 to 10 Gbps | 384 | – |
| fixed-rate-perf-10-v6 | IPv6 fixed rate performance tests, 2.5 to 10 Gbps | 384 | IPv6 |
| perf | IPv4 performance tests | 12 | – |
| perf-v6 | IPv6 performance tests | 12 | IPv6 |
| perf-client | IPv4 performance tests - Per Client Settings | 4 | Multiport |
| perf-client-v6 | IPv6 performance tests - Per Client Settings | 4 | IPv6 and Multiport |
| perf-lan | IPv4 LAN performance tests | 9 | Multiport |
| perf-lan-v6 | IPv6 LAN performance tests | 9 | IPv6 and Multiport |
| perf-mcast | IPv4 multicast performance tests | 2 | – |
| perf-mcast-v6 | IPv6 multicast performance tests | 2 | IPv6 |
| perf-mcast-lan | IPv4 multicast LAN performance tests | 2 | Multiport |
| perf-mcast-lan-v6 | IPv6 multicast LAN performance tests | 2 | IPv6 and Multiport |
| perf-multi | IPv4 multiple LAN client performance tests | 4 | Multiport |
| perf-multi-v6 | IPv6 multiple LAN client performance tests | 4 | IPv6 and Multiport |
Each performance test within these modules verifies a single performance metric in the upstream or downstream directions independently, or in both directions simultaneously (bidirectional), according to the following table:
| Test Cases | Measured Performance Metric | Direction | Traffic Type |
|---|---|---|---|
| perf_1, ipv6_perf_1, perf_client_1, ipv6_perf_client_1, perf_lan_1, ipv6_perf_lan_1, perf_multi_1, ipv6_perf_multi_1 | Throughput | Downstream | TCP |
| perf_2, ipv6_perf_2, perf_client_2, ipv6_perf_client_2, perf_lan_2, ipv6_perf_lan_2, perf_multi_2, ipv6_perf_multi_2 | Throughput | Upstream | TCP |
| perf_3, ipv6_perf_3, perf_client_3, ipv6_perf_client_3, perf_lan_3, ipv6_perf_lan_3, perf_multi_3, ipv6_perf_multi_3 | Throughput | Downstream | UDP |
| perf_4, ipv6_perf_4, perf_client_4, ipv6_perf_client_4, perf_lan_4, ipv6_perf_lan_4, perf_multi_4, ipv6_perf_multi_4 | Throughput | Upstream | UDP |
| perf_mcast_1, ipv6_perf_mcast_1, perf_mcast_lan_1, ipv6_perf_mcast_lan_1 | Throughput | Downstream | Multicast |
| perf_mcast_2, ipv6_perf_mcast_2, perf_mcast_lan_2, ipv6_perf_mcast_lan_2 | Throughput | Upstream | Multicast |
| perf_5, ipv6_perf_5, perf_lan_5, ipv6_perf_lan_5 | Throughput | Both | TCP |
| perf_6, ipv6_perr_6, perf_lan_6, ipv6_perf_lan_6 | Throughput | Both | UDP |
| perf_7, ipv6_perf_7, perf_lan_7, ipv6_perf_lan_7 | Throughout | Download | UDP |
| perf_8, ipv6_perf_8, perf_lan_8, ipv6_perf_lan_8 | Throughput | Upload | UDP |
| perf_9, ipv6_perf_9, perf_lan_9, ipv6_perf_lan_9 | Latency | Both, one direction at a time | UDP |
| perf_10, perf_11 | Latency | Both | DHCPv4 |
| ipv6_perf_10, ipv6_perf_11 | Latency | Both | DHCPv6 |
| perf_12, ipv6_perf_12 | Latency | Both | DNS |
Note that all tests in the DSCP Modules (fixed-dscp-perf-download, fixed-dscp-perf-upload, fixed-dscp-perf-download-v6, fixed-dscp-perf-upload-v6) measure throughput. The bandwidth, direction, address-family, traffic type, number of streams, packet length, and threshold are all defined by the test case.
Tests in the DSCP Modules are designed to dynamically determine performance metrics based on measured throughput and pre-defined DSCP values for different traffic profiles. For more information, see the DSCP Performance Testing section of this guide.
Tests in the Performance Client Modules (perf-client, perf-client-v6), allow for up to 32 LAN clients to use different configurations and thresholds. This is accomplished through the CDRouter Multiport Expansion. See the Performance Client Configuration portion of this guide, as well as the CDRouter Multiport User Guide for more information on configuring additional LAN interfaces and LAN clients.
Like all CDRouter test cases, each performance test generates a high-level PASS or FAIL result. In addition, they produce one or more numeric values for the metric being tested. PASS or FAIL results are determined based upon configurable maximum and minimum thresholds for each type of metric, making it easy to quickly identify whether or not the DUT’s performance is consistent over time and meets expected user defined performance requirements.
For information on the TR-143 HTTP test cases, please refer to the TR-143 section in the CDRouter TR-069 User Guide.
Test Setup
CDRouter Performance has no additional test setup requirements. Any closed loop test setup used for CDRouter functional testing can also be used for performance testing.
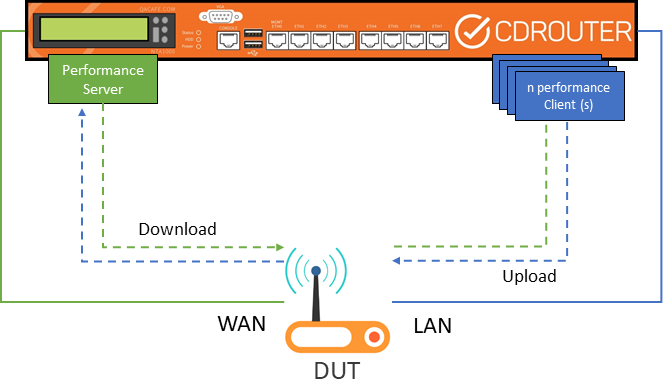
The basic test setup for CDRouter LAN-to-WAN Performance throughput tests is shown below:
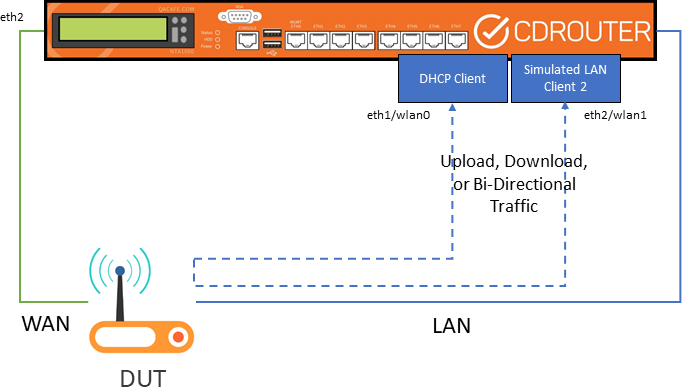
The multiport test setup for CDRouter LAN-to-LAN Performance throughput tests is shown below:
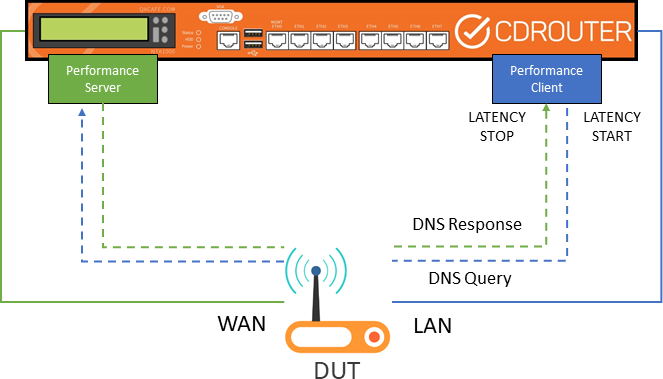
The DNS latency test setup for CDRouter is shown below:
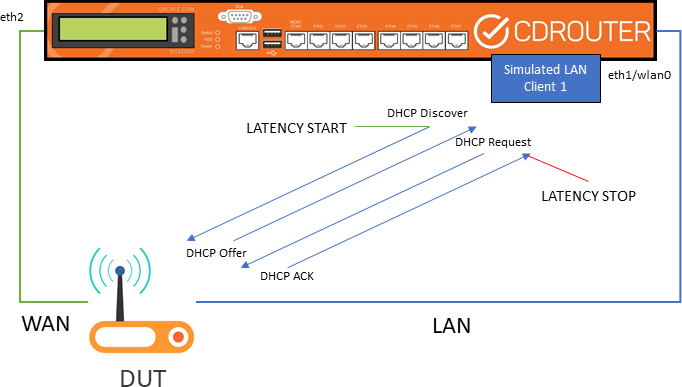
The DHCP latency tests setups for CDRouter is shown below:
Supported WAN Modes
The CDRouter Performance expansion currently supports the following WAN modes:
- IPv4 - static, DHCP, PPPoE
- IPv6 - static, autoconf, DHCPv6, DHCPv6 w/PD, PPPoE
Support for additional WAN modes may be added in future CDRouter releases.
Firewalls
The CDRouter Performance expansion is firewall-friendly. For all download tests the performance client on the LAN will automatically connect to the performance server on the WAN to establish any firewall or NAT entries before sending performance traffic.
Basic Performance Configuration
The CDRouter Performance expansion includes several testvars that can be used to configure the test environment and the behavior of performance related tests.
To globally enable the Performance expansion for a specific configuration, the
testvar supportsPerformance must be set to a value of yes.
All additional testvars provided with the Performance expansion are defined below.
Basic Configuration
Performance Settings
perfDurationperfDownloadBandwidthperfIntervalperfIncrementperfStreamsperfStreamIncrperfUdpLenperfUploadBandwidthperfLantoLanBandwidthperfOmitperfDSCPperfFairness
WAN Download Thresholds
perfDownloadMaxLatencyperfDownloadTcpRetrperfDownloadTcpLowThresholdperfDownloadTcpHighThresholdperfDownloadUdpLossPercentageperfDownloadUdpLowThresholdperfDownloadUdpHighThreshold
WAN Upload Thresholds
perfUploadMaxLatencyperfUploadTcpRetrperfUploadTcpLowThresholdperfUploadTcpHighThresholdperfUploadUdpLossPercentageperfUploadUdpLowThresholdperfUploadUdpHighThreshold
LAN to LAN Thresholds
perfLantoLanMaxLatencyperfLantoLanTcpRetrperfLantoLanTcpLowThresholdperfLantoLanTcpHighThresholdperfLantoLanUdpLossPercentageperfLantoLanUdpLowThresholdperfLantoLanUdpHighThreshold
Application Thresholds
Advanced Options
Note: perfEnableCapture should only be used when additional
debug information is need to troubleshoot connectivity issues. See the
Packet Capture and Performance section
for more information. Note that performance tests will be skipped if
wifiCapture is enabled.
DSCP Performance Testing
The CDRouter DSCP Modules (fixed-dscp-perf-download, fixed-dscp-perf-upload, fixed-dscp-perf-download-v6, fixed-dscp-perf-upload-v6) provide tests designed to exercise the QoS capabilities of a device.
The tests in these modules use DSCP markings based on the diffserv4 definition
described by the tc-cake manual
and additionally described by Bufferbloat.net.
The values used by these tests are given in the table below:
| Name | perfDSCP |
DSCP/PHB Class | Threshold % |
|---|---|---|---|
| Best Effort (Default, generic traffic) | 0x00 | none | 100% (see note) |
| Bulk (file transfers, generally low priority) | 0x20 | CS1 | 6.25% |
| Video | 0x60 | CS3 | 50% |
| Voice | 0x80 | CS4 | 25% |
- Note that Best Effort Traffic should be expected to use the remainder of the available bandwidth after other prioritized traffic has been processed. Therefore, the expected performance threshold of all Best Effort Flows will be equal to the remaining capacity divided by the number of Best Effort Flows. For example, with 1 Video Flow, and 2 Best Effort Flows, the thresholds will be set at 50%, 25%, 25%, respectively.
The performance clients are configured as either the Application Flow or Background Flow. The Application Flow will always have either Video or Voice UDP traffic, and the Background Flow will carry different combinations of traffic based on the table below. Additional performance clients (as determined by the configuration) will carry default (unmarked) Best Effort TCP Traffic.
To effectively test the QoS capabilities of the DUT, multiple flows of traffic, using CDRouter LAN Clients, are necessary. A minimum of 2 LAN Clients is required.
Tests in these modules create a performance client for each lanClient configured.
This can be done with either multiple lanClients on a single
physical interface, or with additional LAN interface(s), or a combination of the two.
In order to utilize multiple physical ports, the CDRouter Multiport Expansion is needed.
All clients utilize a single stream of data.
The configuration of LAN Clients required to test QoS depends on the interface speed of the DUT. See the DSCP Performance Examples section for possible configurations.
The fixed tests cover traffic profiles for IPv4 and IPv6, upload and download, TCP, UDP, and with different combination of DSCP markings. The combinations are given below and are applied to IPv4 or IPv6, and download or upload. Note that the tests described will use either IPv4 or IPv6, not both, and data flows in the same direction.
| Application | Transport | Tin Threshold | Background | Transport | Tin Threshold |
|---|---|---|---|---|---|
| Video | UDP | 50% | Best Effort | UDP | 50% |
| Video | UDP | 50% | Best Effort | TCP | 50% |
| Video | UDP | 50% | Bulk | UDP | 6.25% |
| Video | UDP | 50% | Bulk | TCP | 6.25% |
| Video | UDP | 50% | Video | UDP | 50% |
| Video | UDP | 50% | Voice | UDP | 25% |
| Voice | UDP | 25% | Best Effort | UDP | 50% |
| Voice | UDP | 25% | Best Effort | TCP | 50% |
| Voice | UDP | 25% | Bulk | UDP | 6.25% |
| Voice | UDP | 25% | Bulk | TCP | 6.25% |
| Voice | UDP | 25% | Video | UDP | 25% |
| Voice | UDP | 25% | Voice | UDP | 50% |
DSCP Test Summary
For each test case, a baseline throughput is measured prior to starting the
Application and Background Flows, this is referred to as the Measurement Phase.
For each lanClients, a Measurement Flow is created one at a time,
and sends UDP traffic for perfDuration
seconds using the default best effort DSCP (0x00) and records the resulting measured
throughput. The bandwidth and threshold for the accompanying Application or
Background flow are based on this measured throughput.
The throughput of each Application or Background flow will be set to 100% of the measured throughput. For example, with 2 clients there will be a total throughput of 200%, to stress the device and its buffers.
The expected final threshold is the result of the tin threshold applied to the measured throughput, a Passing result is given when the final flow throughput is above 90% of the threshold. See the below example:
Flow Bandwidth = Measured Throughput * 1.0
Flow Threshold = Measured Throughput * Tin Threshold
PASS: Flow Measured Throughput  > 0.90 * Flow Threshold
The calculation is applied to both the Application and Background Flows, and all flows must meet the threshold to be evaluated as PASS.
Additionally, the UDP loss metric can be used to indicate if a bottleneck exists and QoS was not tested. If the packet loss for any test stream is less than 5%, a log message will be generated indicating that a bottleneck may not have been present. PASS/FAIL determinations are not made based on this metric.
DSCP Testing Examples
In order for the QoS capabilities of the DUT to be effectively tested, there must exist a bottleneck for traffic transiting the DUT. This can be created by combining physical interfaces, or artificially enforced through configuration or rate limiting.
For example, a typical 5-port Home Gateway, with four (4) 1 Gbps LAN interfaces and a single (1) 1 Gbps WAN interface has a bottleneck in the Upload (LAN to WAN) direction. This will force the device to buffer (or queue), and eventually drop, packets, while other buffers (or queues) are emptied. The QoS method by which the DUT selects which queue to empty is what this module aims to test.
Additionally, using the same example as above, in contrast the Download (WAN to LAN) direction does not cause a traffic bottleneck and does not require special treatment by the DUT in the default case. Packets entering the DUT on the WAN may be forwarded directly to the LAN without incurring any additional delays or loss.
QoS Testing Options - 1 Gbps DUT
-
WAN + WLAN: This combination can be used for QoS testing in the Upload direction, using 2 or more
lanClientswith different DSCP markings. This is because the WLAN interface ingress capacity is greater than the WAN egress capacity. -
WAN + LAN: This combination of WAN and 2 or more physical LAN interfaces (e.g. LAN1 + LAN2) can be used for QoS testing in the Upload direction. This is because the ingress capacity of the LAN, which is the sum of the physical LAN interfaces in use, is greater than the WAN egress capacity. Multiple
lanClientsmay be configured on each LAN. However, note that the interface(s) carrying prioritized traffic should not have more than one 1lanClients, to ensure enough prioritized traffic is reaching the DUT. -
WAN + WLAN/LAN: A combination of WAN and (WLAN + LAN) can be used for QoS testing in the Upload Direction.
-
QoS testing cannot be performed in the Download direction, as the ingress capacity of the WAN is less than or equal to the egress capacity of any 1 or more WLAN or LAN interface.
1 Gbps DUT Example

QoS Testing Options - 2.5 Gbps DUT
-
WAN + WLAN: The combination of WAN + WLAN may be used for testing in either the Download or Upload direction, depending on the bit rate and speed of the wireless LAN. If the WLAN is faster than 2.5G, then testing should be performed in the Upload direction. If the WLAN is slower than 2.5G, then testing should be performed in the Download direction. 2 or more
lanClientsmust be used. -
WAN + LAN Download: The combination of WAN and 1 or 2 physical LAN interfaces (e.g. LAN1 + LAN2) can be used for QoS testing in the Download direction. This is because the ingress capacity of the WAN is greater than the sum of the egress capacity of the physical LAN interfaces in use. Multiple
lanClientsmay be configured on each LAN. However, note that the interface(s) carrying prioritized traffic should not have more than one 1lanClients, to ensure enough prioritized traffic is reaching the DUT. -
WAN + LAN Upload: The combination of WAN and 3 or more physical LAN interfaces (e.g. LAN1 + LAN2 + LAN3) can be used for QoS testing in the Upload direction. This is because the ingress capacity of the LAN, which is the sum of the physical LAN interfaces in use, is greater than the WAN egress capacity. Multiple
lanClientsmay be configured on each LAN. However, note that the interface(s) carrying prioritized traffic should not have more than one 1lanClients, to ensure enough prioritized traffic is reaching the DUT. -
WAN + WLAN/LAN: A combination of WAN and (WLAN + LAN) can be used for QoS testing in either the Download or Upload direction. Note that the direction of testing should match the direction of the egress bottleneck. For example, if the combination of WLAN and LAN interfaces egress is slower than the WAN ingress, the Download direction should be used. If the combination of WLAN and LAN interface ingress is faster than the WAN egress, the Upload direction should be used.
2.5 Gbps DUT Example

QoS Testing Options - 10 Gbps DUT
-
WAN + WLAN: The combination of WAN + WLAN may be used for testing in either the Download or Upload direction, depending on the bit rate and speed of the wireless LAN. If the WLAN is faster than 10G, then testing should be performed in the Upload direction. If the WLAN is slower than 10G, then testing should be performed in the Download direction. 2 or more
lanClientsmust be used. -
WAN + 10G LAN/1G LAN Upload: The combination of WAN and 1 10G LAN and 1 or more 1G LAN (e.g. LANX + LAN2 + LAN3) can be used for testing in the Upload direction. This is because the ingress capacity of the physical LAN is greater than the egress capacity of the WAN. However, as the speed of LANX is significantly greater than any one or more 1G LAN interfaces, the QoS of prioritized traffic on the LANX interface is unlikely to be greatly affected. One possible testing scenario is to utilize the LANX interface for non-prioritized traffic, and to use a 1G LAN for prioritized traffic, to ensure that QoS on the 1G LAN is maintained.
-
WAN + 1G LAN Download: The combination of WAN and 1 or 2 physical 1G LAN interfaces (e.g. LAN2 + LAN3) can be used for QoS testing in the Download direction. This is because the ingress capacity of the WAN is greater than the sum of the egress capacity of the physical LAN interfaces in use. Multiple
lanClientsmay be configured on each LAN. However, note that the interface(s) carrying prioritized traffic should not have more than one 1 lanClient, to ensure enough prioritized traffic is reaching the DUT. -
WAN + LAN Upload: The combination of WAN and 3 or more physical LAN interfaces (e.g. LAN1 + LAN2 + LAN3) can be used for QoS testing in the Upload direction. This is because the ingress capacity of the LAN, which is the sum of the physical LAN interfaces in use, is greater than the WAN egress capacity. Multiple
lanClientsmay be configured on each LAN. However, note that the interface(s) carrying prioritized traffic should not have more than one 1 lanClient, to ensure enough prioritized traffic is reaching the DUT. -
WAN + WLAN/LAN: A combination of WAN and (WLAN + LAN) can be used for QoS testing in either the Download or Upload direction. Note that the direction of testing should match the direction of the egress bottleneck. For example, if the combination of WLAN and LAN interfaces egress is slower than the WAN ingress, the Download direction should be used. If the combination of WLAN and LAN interface ingress is faster than the WAN egress, the Upload direction should be used.
10 Gbps DUT Example

DSCP Perf Testvars
Only the perfPort and perfDuration testvars may
be configured by the user. All other testvars are overridden and fixed to
pre-determined values as described above for the DSCP modules.
In the case of perfDuration, this is the duration of any one
performance flow used during the test run. During the measurement phase, a
performance test is run on each LAN Client in serial. During the test phase,
the performance tests are run in parallel. For example, a perfDuration
of 30s, with 3 LAN Clients would result in a test run of approximately 2 minutes
((3*30) + 30 = 120s) not including setup and teardown time.
QoS DUT Configuration
The nature of QoS is highly dependent on local variables, including expected
traffic types, load, interface speeds, the devices in the network, and policy.
As such, the configuration options are usually unique from one device to another,
and no specific recommendation on configurations can be given. However, the
performance thresholds used by the DSCP Perf Modules are based on diffserv4,
and the DUT should configure thresholds or service classes following those guidelines.
QoS Transient Clients
QoS Testing will be most effective when utilizing multiple flows spread across
different interfaces with multiple LAN Clients. The
CDRouter Multiport expansion
is the best way to efficiently test different combinations of ports. However,
in situations where there is a significant speed disparity between the WAN and LAN,
multiple ports may not be necessary. In these cases, it may be useful to test without
multiple ports, and without leveraging the Multiport expansion. For these situations,
if the number of configured lanClients is 1, the DSCP module will create 2
additional transient clients. These clients are used for generating background traffic,
and will be removed at the conclusion of the test case. These transient clients do
not require the Multiport expansion.
Wireless Performance Configuration
An additional wireless configuration section may be added to the base configuration. This allows a single configuration file to contain different settings for both wired and wireless interfaces. CDRouter will then automatically use the appropriate wired or wireless performance settings based on the underlying interface used for a particular test.
Wireless specific performance settings can be enabled by removing the keyword
IGNORE from the wireless-performance testvar_group declaration in the
default configuration file.
Note that only the testvars listed below can be defined for both wired and wireless interfaces.
testvar_group wireless-performance {

    SECTION "Performance Settings" {

        testvar perfDownloadBandwidth
        testvar perfUploadBandwidth
        testvar perfLantoLanBandwidth

    }

    SECTION "WAN Download Thresholds" {

        testvar perfDownloadMaxLatency
        testvar perfDownloadTcpRetr
        testvar perfDownloadTcpLowThreshold
        testvar perfDownloadTcpHighThreshold
        testvar perfDownloadUdpLossPercentage
        testvar perfDownloadUdpLowThreshold
        testvar perfDownloadUdpHighThreshold

    }

    SECTION "WAN Upload Thresholds" {

        testvar perfUploadMaxLatency
        testvar perfUploadTcpRetr
        testvar perfUploadTcpLowThreshold
        testvar perfUploadTcpHighThreshold
        testvar perfUploadUdpLossPercentage
        testvar perfUploadUdpLowThreshold
        testvar perfUploadUdpHighThreshold

    }

    SECTION "LAN to LAN Thresholds" {

        testvar perfLantoLanMaxLatency
        testvar perfLantoLanTcpRetr
        testvar perfLantoLanTcpLowThreshold
        testvar perfLantoLanTcpHighThreshold
        testvar perfLantoLanUdpLossPercentage
        testvar perfLantoLanUdpLowThreshold
        testvar perfLantoLanUdpHighThreshold

    }

    SECTION "Application Thresholds" {

        testvar perfDHCPRenewMaxLatency
        testvar perfDHCPRestartMaxLatency
        testvar perfDNSMaxLatency

    }

}
Running Performance Tests
To enable performance testing within CDRouter, uncomment the testvar supportsPerformance
and set it to a value of yes. This will enable
performance testing for IPv4 using default values for all performance options.
The IPv6 and Multiport expansions must be enabled and configured in order to test
IPv6 performance, LAN-to-LAN performance, or multi-client performance. The
testvar useSameLanInterface should be set to yes when
testing LAN-to-LAN performance.
Performance test cases are selected and added to a test package in the same manner as functional test cases. Test packages may contain a mix of performance and functional tests.
The pass or fail determination for performance tests is based on user defined throughput and latency thresholds (both maximum and minimum) that must be met. If a performance test metric lies within the specified thresholds, the test will pass, otherwise it will fail.
Throughput Test Cases
When a throughput performance test is executed, CDRouter will automatically
generate and log performance data at an interval specified by the testvar
perfInterval. By default, CDRouter will determine an appropriate
interval based on the total duration of the test. A value ‘0’ can also be
specified, which disables interval statistics and prints only the end of test
to the log. This setting reduces the number of log messages which can be helpful
when testing with multiple streams, as specified by perfStreams.
The CDRouter Performance expansion supports up to 128 simultaneous streams per
client. The number of streams can also be incremented automatically by
CDRouter by specifying the perfStreamIncr testvar. When this
testvar is enabled CDRouter will increment the stream count by the specified
amount with each iteration of a test. This makes it possible to assess the
performance of a system as the stream number increases.
Here is an example log file showing how performance data is displayed while a throughput performance test is running:
2017-08-03 14:42:14.993 SECTION(cdrouter-4671): Setting up LAN and WAN performance test
2017-08-03 14:42:15.616 INFO(cdrouter-4671): Capture files will filter out performance data

2017-08-03 14:42:17.621 SECTION(cdrouter-4671): Starting performance test server at 202.254.1.4
2017-08-03 14:42:17.621 INFO(cdrouter-4671): Target download bandwidth is 500.0M (0=unlimited)

2017-08-03 14:42:18.628 SECTION(cdrouter-4671): Starting IPv4 UDP performance test at 202.254.1.11
2017-08-03 14:42:18.628 INFO(lan):
2017-08-03 14:42:18.628 INFO(lan): Connect to performance server at 202.254.1.4:19750 using the following:
2017-08-03 14:42:18.628 INFO(lan):
2017-08-03 14:42:18.629 INFO(lan):       direction: download ( source 202.254.1.4:19750 -> destination 202.254.1.11 )
2017-08-03 14:42:18.629 INFO(lan):       bandwidth: 500.0M (0=unlimited)
2017-08-03 14:42:18.629 INFO(lan):        duration: 10
2017-08-03 14:42:18.629 INFO(lan):        protocol: UDP
2017-08-03 14:42:18.629 INFO(lan):         streams: 1
2017-08-03 14:42:18.629 INFO(lan):          length: 1472
2017-08-03 14:42:18.629 INFO(lan):
2017-08-03 14:42:18.655 I<<<(lan-1): b0:75:0c:85:44:41                       b0:75:0c:1b:17:e5                       ARP       202.254.1.4 is at b0:75:0c:85:44:41
2017-08-03 14:42:18.656 INFO(lan): Connecting to host 202.254.1.4, port 19750
2017-08-03 14:42:18.656 INFO(lan): Reverse mode, remote host 202.254.1.4 is sending
2017-08-03 14:42:18.657 I<<<(wan-1): b0:75:0c:1b:17:e5                       ff:ff:ff:ff:ff:ff                       ARP       Who is 202.254.1.4, tell 202.254.1.11
2017-08-03 14:42:18.657 INFO(wan): ARP request, who is 202.254.1.4, tell 202.254.1.11
2017-08-03 14:42:19.733 INFO(lan): [  5] local 202.254.1.11 port 36844 connected to 202.254.1.4 port 19750
2017-08-03 14:42:19.733 INFO(lan): [ ID] Interval           Transfer     Bandwidth       Jitter    Lost/Total Datagrams
2017-08-03 14:42:19.733 INFO(lan): [  5]   0.00-1.00   sec  59.0 MBytes   495 Mbits/sec  0.020 ms  472/42532 (1.1%)
2017-08-03 14:42:20.733 INFO(lan): [  5]   1.00-2.00   sec  59.9 MBytes   503 Mbits/sec  0.024 ms  0/42677 (0%)
2017-08-03 14:42:21.733 INFO(lan): [  5]   2.00-3.00   sec  59.2 MBytes   497 Mbits/sec  0.018 ms  0/42183 (0%)
2017-08-03 14:42:22.733 INFO(lan): [  5]   3.00-4.00   sec  59.5 MBytes   499 Mbits/sec  0.017 ms  598/42948 (1.4%)
2017-08-03 14:42:23.733 INFO(lan): [  5]   4.00-5.00   sec  58.9 MBytes   494 Mbits/sec  0.026 ms  0/41965 (0%)
2017-08-03 14:42:24.733 INFO(lan): [  5]   5.00-6.00   sec  60.2 MBytes   505 Mbits/sec  0.024 ms  0/42910 (0%)
2017-08-03 14:42:25.733 INFO(lan): [  5]   6.00-7.00   sec  59.0 MBytes   495 Mbits/sec  0.014 ms  0/42019 (0%)
2017-08-03 14:42:26.733 INFO(lan): [  5]   7.00-8.00   sec  59.3 MBytes   497 Mbits/sec  0.020 ms  299/42534 (0.7%)
2017-08-03 14:42:27.733 INFO(lan): [  5]   8.00-9.00   sec  60.1 MBytes   504 Mbits/sec  0.015 ms  0/42835 (0%)
2017-08-03 14:42:28.813 INFO(lan): [  5]   9.00-10.00  sec  59.2 MBytes   496 Mbits/sec  0.022 ms  0/42144 (0%)
2017-08-03 14:42:28.813 INFO(lan): - - - - - - - - - - - - - - - - - - - - - - - - -
2017-08-03 14:42:28.814 INFO(lan): [ ID] Interval           Transfer     Bandwidth       Jitter    Lost/Total Datagrams
2017-08-03 14:42:28.814 INFO(lan): [  5]   0.00-10.00  sec   596 MBytes   499 Mbits/sec  0.022 ms  1369/424747 (0.32%)
2017-08-03 14:42:28.814 INFO(lan): [  5] Sent 424747 datagrams
2017-08-03 14:42:28.815 INFO(lan):
2017-08-03 14:42:28.832 INFO(cdrouter-4671): UDP download throughput over 10.0 seconds is 499 Mbits/sec
2017-08-03 14:42:28.832 INFO(cdrouter-4671): UDP jitter is 0.022 ms with a loss rate of 0.32230952%
2017-08-03 14:42:28.832 PASS(cdrouter-4671): UDP download throughput of 499 Mbits/sec is greater than UDP low threshold of 10.0 Mbits/sec
CDRouter will also generate a final performance report and log it at the end of the test:
2017-08-03 14:42:28.837 SECTION(cdrouter-4671): Displaying all measured performance intervals

Connecting to host 202.254.1.4, port 19750
Reverse mode, remote host 202.254.1.4 is sending
[  5] local 202.254.1.11 port 36844 connected to 202.254.1.4 port 19750
[ ID] Interval           Transfer     Bandwidth       Jitter    Lost/Total Datagrams
[  5]   0.00-1.00   sec  59.0 MBytes   495 Mbits/sec  0.020 ms  472/42532 (1.1%)
[  5]   1.00-2.00   sec  59.9 MBytes   503 Mbits/sec  0.024 ms  0/42677 (0%)
[  5]   2.00-3.00   sec  59.2 MBytes   497 Mbits/sec  0.018 ms  0/42183 (0%)
[  5]   3.00-4.00   sec  59.5 MBytes   499 Mbits/sec  0.017 ms  598/42948 (1.4%)
[  5]   4.00-5.00   sec  58.9 MBytes   494 Mbits/sec  0.026 ms  0/41965 (0%)
[  5]   5.00-6.00   sec  60.2 MBytes   505 Mbits/sec  0.024 ms  0/42910 (0%)
[  5]   6.00-7.00   sec  59.0 MBytes   495 Mbits/sec  0.014 ms  0/42019 (0%)
[  5]   7.00-8.00   sec  59.3 MBytes   497 Mbits/sec  0.020 ms  299/42534 (0.7%)
[  5]   8.00-9.00   sec  60.1 MBytes   504 Mbits/sec  0.015 ms  0/42835 (0%)
[  5]   9.00-10.00  sec  59.2 MBytes   496 Mbits/sec  0.022 ms  0/42144 (0%)
- - - - - - - - - - - - - - - - - - - - - - - - -
[ ID] Interval           Transfer     Bandwidth       Jitter    Lost/Total Datagrams
[  5]   0.00-10.00  sec   596 MBytes   499 Mbits/sec  0.022 ms  1369/424747 (0.32%)
[  5] Sent 424747 datagrams
Application Latency Test Cases
When an application latency performance test is executed, CDRouter will automatically send the necessary application traffic and record a timestamp. A timestamp will also be recorded when the reply is received. The difference between the initial timestamp and the reply’s timestamp is recorded as the in the log as the application latency. This is repeated multiple times to determine the average application latency. The average is validated against the threshold specified in the configuration file to determine if the test passes or fails.
Here is an example log file showing how performance data is displayed while a application latency performance test is running:
2017-08-10 15:53:50.191 SECTION(cdrouter-4792): Measuring DNS query latency
2017-08-10 15:53:50.191 INFO(lan): DNS lookup host.domain5566b8e25a4f4.cdroutertest.com on DNS server 192.168.1.1:53
2017-08-10 15:53:50.192 O>>>(lan-8): 192.168.1.173                           192.168.1.1                             DNS       Query A host.domain5566b8e25a4f4.cdroutertest.com
2017-08-10 15:53:50.192 INFO(lan): Waiting up to 5 seconds for a DNS response packet on port 13402
2017-08-10 15:53:50.193 I<<<(wan-7): 202.254.1.2                             202.254.101.1                           DNS       Query A host.domain5566b8e25a4f4.cdroutertest.com
2017-08-10 15:53:50.194 INFO(dns1): 202.254.101.1:53 received UDP from 202.254.1.2:62248
2017-08-10 15:53:50.194 INFO(dns1): Received DNS query for host.domain5566b8e25a4f4.cdroutertest.com with type A
2017-08-10 15:53:50.194 INFO(dns1): Found DNS entry for host.domain5566b8e25a4f4.cdroutertest.com with type A
2017-08-10 15:53:50.194 INFO(dns1): Found matching record: host.domain5566b8e25a4f4.cdroutertest.com - Type: A => 2.2.2.2
2017-08-10 15:53:50.194 INFO(dns1): DNS response sent to DNS query (0x9676) from 202.254.1.2:62248
2017-08-10 15:53:50.195 O>>>(wan-8): 202.254.101.1                           202.254.1.2                             DNS       host.domain5566b8e25a4f4.cdroutertest.com is at 2.2.2.2
2017-08-10 15:53:50.196 I<<<(lan-9): 192.168.1.1                             192.168.1.173                           DNS       host.domain5566b8e25a4f4.cdroutertest.com is at 2.2.2.2
2017-08-10 15:53:50.196 INFO(lan): 192.168.1.173:13402 received UDP from 192.168.1.1:53
2017-08-10 15:53:50.196 INFO(lan): Found UDP session at port 13402
2017-08-10 15:53:50.197 INFO(lan): DNS response with host.domain5566b8e25a4f4.cdroutertest.com at 2.2.2.2
2017-08-10 15:53:50.197 PASS(cdrouter-4792): DNS query completed in 3404 usec
2017-08-10 15:53:50.297 PASS(cdrouter-4792): Average DNS latency of 3210 usec is below max latency of 50000
Multi-client Performance Tests
Performance testing with up to 32 LAN clients is supported using the perf-multi, perf-multi-v6, perf-client, and perf-client-v6 test modules. These test modules each include four test cases. The four test cases verify the aggregate throughput of TCP and UDP traffic across multiple clients in the upload and download directions for IPv4 and IPv6, respectively.
Multi-client performance testing requires the Multiport expansion and optionally the IPv6 expansion. All LAN clients used for multi-client performance testing must be created during start as separate physical interfaces, virtual LAN test interfaces, or additional LAN clients. Please see the CDRouter Multiport User Guide for more information on configuring additional LAN interfaces and LAN clients.
If more than 32 Ethernet LAN clients exist, the current LAN client and the next 31 available clients will be used for multi-client performance tests. The exact list of clients used will vary from one test to the next as CDRouter rotates through LAN interfaces, which is the default setting with Multiport configurations.
A maximum of 30 streams per client can be configured using the perfStreams testvar. With 32 Ethernet clients and 30 streams per client, a maximum of 960 TCP or UDP streams can be created during multi-client performance tests.
Multi-client Performance Testing Limitations
NTA1000 series platforms with the Wi-Fi Virtualization expansion enabled support up to 32 wireless LAN clients for all multi-client performance tests. This allows any combination of wired and/or wireless LAN clients, up to a maximum of 32, to be tested.
NOTE: Due to a known, reported interoperability issue with the MediaTek Wi-Fi chipset used in the NTA3000 and certain CPE, all NTA3000 systems are limited to a maximum of three (3) virtualized wireless LAN clients per radio for all single-client or multi-client performance tests. This limitation improves performance and reduces, but does not mitigate entirely, occurrences of system instability.
This limitation caps the maximum number of wireless LAN clients that can be used for multi-client performance tests to 19 on the NTA3000:
| NTA3000 Radio | Band | Max Number of Clients per Radio for Performance Testing (NTA3000) |
|---|---|---|
| wifi1-ax24 | 2.4 GHz | 3 |
| wifi2-ax56 | 5 GHz | 3 |
| wifi3-ax24 | 2.4 GHz | 3 |
| wifi4-ax56 | 5 GHz | 3 |
| wifi5-ax24 | 2.4 GHz | 3 |
| wifi6-ax24 | 6 GHz | 3 |
| wifi7-be | Tri-band | 1 |
For multi-client performance tests, testing with 32 LAN clients on the NTA3000 is possible using a mix of wired and wireless LAN clients. These limitations apply only to performance tests on the NTA3000. Functional tests are not subject to this same limitation. In addition, only the first three (3) wireless LAN clients per radio will be used for performance tests on the NTA3000.
Throughput Tests
The testvars perfUploadBandwidth and
perfDownloadBandwidth define the transmit bandwidth per stream
for all CDRouter performance tests. The total aggregate transmit bandwidth per
test, across all clients and streams, is the transmit bandwidth per stream times
the number of streams.
For multi-client performance tests CDRouter will automatically divide the total aggregate transmit bandwidth per test by the number of clients to determine the transmit bandwidth per client. This makes it possible to quickly and consistently compare single client performance results to multi-client performance results because the total aggregate transmit bandwidth per test remains the same regardless of the number of LAN clients in use.
When the transmit bandwidth per stream is set to 0, CDRouter will automatically set bandwidth on each client based on either a 1 Gbps or 10 Gbps interface. In some cases this may not be that accurate, for example when running tests over an 802.11 n wireless interface. For the best and most consistent results the transmit bandwidth per stream should be set accurate based on the physical interface in use and/or the expected performance of the DUT.
The following table defines the relationship between various testvars, transmit bandwidths, the number of streams, and the number of clients.
| Variable | Description | Value |
|---|---|---|
b |
Transmit bandwidth per stream | perfUploadBandwidth or perfDownloadBandwidth |
s |
Number of streams | perfStreams |
c |
Number of clients | Based on configuration |
ab |
Aggregate transmit bandwidth per test, across all streams and clients | = b * s |
cb |
Transmit bandwidth per client | = ab / c |
The calculations for various configurations are provided in the examples below.
This is the simplest configuration which utilizes a single client and a single stream. In this example the transmit bandwidth per stream is set to 200 Mbps.
b  = 200
s  = 1
c  = 1
ab = 200
cb = 200
If the transmit bandwidth is set to 200 Mbps, the aggregate transmit bandwidth
per test (ab) and per client (cb) will also be 200 Mbps.
In this example the number of streams is set to five while the number of clients remains at one and the transmit bandwidth per stream at 200 Mbps.
b  = 200
s  = 5
c  = 1
ab = 1000
cb = 1000
With this configuration the transmit bandwidth per test and per client will be 1000 Mbps. To retain an aggregate transmit bandwidth per test of 200 Mbps, the transmit bandwidth per stream must be divided by the number of streams. Reducing the transmit bandwidth per stream to 40 Mbps will produce an aggregate throughput per test of 200 Mbps.
In this example the number of clients is set to 10 while the number of streams remains at one and the transmit bandwidth per stream at 200 Mbps.
b  = 200
s  = 1
c  = 10
ab = 200
cb = 20
With this configuration the transmit bandwidth per test will be 200 Mbps. CDRouter will automatically divide the aggregate transmit bandwidth per test by the total number of clients to determine transmit bandwidth per client. In this example each of the 10 LAN clients will transmit at 20 Mbps.
In this example the number of streams per client is set to five and the number of clients is set to 10 while transmit bandwidth per stream remains at 200 Mbps.
b  = 200
s  = 5
c  = 10
ab = 1000
cb = 100
With this configuration the transmit bandwidth per test will be 1000 Mbps while the transmit bandwidth per client is 100 Mbps. To retain an aggregate transmit bandwidth per test of 200 Mbps, the transmit bandwidth per stream must be divided by the number of streams. Reducing the transmit bandwidth per stream to 40 Mbps will produce an aggregate throughput per test of 200 Mbps.
In some scenarios the transmit bandwidth per stream may need to be calculated based on a target aggregate transmit bandwidth per test across all clients and streams.
For example, to achieve an aggregate transmit bandwidth per test of 100 Mbps using 10 clients and five streams per client, the transmit bandwidth per stream must be set to 20 Mbps.
b  = ab / s = 20
s  = 5
c  = 10
ab = 100
cb = ab / c = 10
Thresholds and Fairness
The PASS or FAIL metrics for all multi-client performance tests are based on the same upload and download bandwidth thresholds (both minimum and maximum) that are defined in the configuration file for single client performance tests. For multi-client performance tests CDRouter will automatically divide the configured thresholds by the number of clients to determine the per-client pass/fail bandwidth thresholds.
Multi-client UDP performance tests will automatically skip the first second of
performance measurements when calculating the total bandwidth. For multi-client
TCP performance tests the number of seconds to omit from the bandwidth
calculations is configurable using the perfOmit testvar.
In addition to verifying the total bandwidth of all clients, the
multi-client performance tests add a second optional check to verify that each
individual client achieved a proportional amount of the total bandwidth. This
second check is enabled by setting the testvar perfFairness to
a value of yes. When fairness is enabled CDRouter will verify that each
client achieved at least an equal portion of the total bandwidth +/- 2%.
Performance Client Testing
Tests in the Performance Client modules (perf-client, perf-client-v6), enable the user to configure unique Performance Testing profiles for each LAN client. This is in contrast to the Multi-client Performance Tests which share a single configuration across all configured LAN Clients.
To take advantage of individual client configuration, the
CDRouter Multiport Expansion
is required, in addition to the Performance Expansion, and optionally the IPv6
Expansion. Additional LAN test interfaces, defined by the testvar_group keyword,
may each define a set of Performance Testvars.
See the CDRouter Multiport User Guide
for more information as well as the below example.
...
SECTION "Base Configuration" {

    SECTION "LAN" {

        SECTION "LAN Interface" {

            testvar lanInterface                     eth2

        }
    }

}
...
SECTION "CDRouter Multiport Expansion" {

    SECTION "Additional LAN Interface Setup" {

        testvar useSameLanInterface              yes

        testvar_group lan2 {
            SECTION "IPv4 LAN" {

                SECTION "LAN Interface" {
                    testvar lanInterface                     eth3
                    testvar lanClients                       1
                }
            }

            ### These settings define an Additional Performance Client
            ### with these settings on eth3
            SECTION "CDRouter Performance Expansion" {

                SECTION "Performance Settings" {

                    testvar perfDuration                     60
                    testvar perfDownloadBandwidth            400
                }

                SECTION "WAN Download Thresholds" {

                    testvar perfDownloadTcpLowThreshold      395
                    testvar perfDownloadUdpLowThreshold      395
                }
            }
        }
    }
}

### These settings are used by the Main LAN Interface (eth2),
SECTION "CDRouter Performance Expansion" {

    testvar supportsPerformance              yes

    SECTION "Performance Settings" {

        testvar perfDuration                     60
        testvar perfDownloadBandwidth            200
    }

    SECTION "WAN Download Thresholds" {

        testvar perfDownloadTcpLowThreshold      195
        testvar perfDownloadUdpLowThreshold      195
    }
}
The most common use case for the tests in the perf-client and perf-client-v6 modules is to configure multiple clients transmitting at different rates with different thresholds. This can be done using the same physical LAN interface or with multiple LAN interfaces. In order to achieve a PASS result, all clients must be within the defined thresholds according to the individual client configuration.
This is in contrast to tests in the perf-multi and perf-multi-v6 modules, where all clients transmit at the same rate and all clients must achieve the same configured threshold, as defined by the global Performance Settings.
Analyzing Throughput Performance Results
CDRouter measures application-layer data throughput. This is the rate of data passed using TCP or UDP. This rate calculation is independent of the lower level protocol headers which are not included in CDRouter’s throughput measurement. Line-rate is often debated when discussing bandwidth and throughput. CDRouter Performance metrics are based on the application-layer and not at the interface-layer. This is considered ’line-rate of usable data’ or sometimes referred to as ‘goodput’.
NOTE: Be careful when comparing throughput performance numbers from one test tool to another. It is important to know how the performance results are measured and presented. Some tools may generate performance metrics based on raw packet data rates whereas other tools may base performance calculations on payload or application data rates (such as CDRouter).
CDRouter may be configured with a target bandwidth or an unbounded bandwidth. In the unbounded case, CDRouter will attempt to send traffic as fast as possible for either TCP or UDP. In the case of UDP, unbounded bandwidth may produce high packet loss especially when the forwarding path contains interfaces with different speeds (.i.e to/from a wireless LAN client and a host on the wired WAN).
NOTE: When analyzing UDP throughput results, it’s important to note that packets arriving out of order are counted as a lost packet, but they are still used to calculate achieved bandwidth (throughput). For more information on this topic refer to the Knowledge Base article here.
Understanding the Theoretical Maximum
The theoretical maximum application throughput varies slightly between UDP and TCP. However, the approximate maximum value for each transport protocol can be calculated by subtracting the total length of the lower level headers. For example, a DUT with a Gigabit Ethernet interface on both its WAN and LAN will not achieve a throughput of 1,000Mb/sec. The theoretical maximum application throughput in this case is a bit less due to frame/packet/segment overhead.
The following equations explain how to calculate the theoretical maximum application throughput:
UDP over IPv4
The maximum size for a regular Ethernet frame is 1,518 bytes. In order to transmit this frame, an additional 20 bytes must be included for the preamble, frame delimiter and inter-frame gap. This means for each maximum size Ethernet frame sent, a total 1,538 bytes need to be transmitted.
The amount of actual usable data, or payload, in that frame (without VLAN ID) is:
1,518 - 18 (Ethernet frame) - 20 (IPv4 header) - 8 (UDP header) = 1,472 bytes
So for each maximum sized Ethernet frame that is transmitted, only 1,472 bytes are payload or application data. As a result, the efficiency can be calculated as:
Total Payload in Bytes / Total Number of Bytes Transmitted = Efficiency
In this example, the UDP efficiency is:
1,472 / 1,538 = .957 or 95.7% = UDP Efficiency
Therefore, the theoretical maximum application throughput is:
Efficiency * Physical Layer Net Bit Rate = Theoretical Maximum Application Throughput (in bits)
Since Gigabit Ethernet’s physical layer net bit rate is 1,000 Mb/sec, the theoretical maximum application throughput in this example is:
.957 * 1,000 = 957 Mb/sec = Maximum Application Throughput for UDP
TCP over IPv4
For TCP it uses a header that is 20 bytes instead of 8. This changes the efficiency calculation, slightly. The additional 12 bytes of header means 12 fewer bytes of data, or 1,460 bytes instead of 1,472 in a max-sized Ethernet frame.
1,460 / 1,538 = .949 or 94.9% = TCP Efficiency
As a result, the theoretical maximum application throughput for TCP is less than that of UDP:
.949 * 1,000 = 949 Mb/sec = Maximum Application Throughput for TCP
In practice, the maximum application throughput for TCP is even less than the theoretical maximum because of the need for acknowledgments and due to other TCP window settings. A more realistic theoretical maximum application throughput figure for TCP is approximately 942 Mb/sec.
The above calculations were derived from the information presented on this Wiki page.
NOTE: CDRouter uses an IP layer MTU of 1500 bytes on Ethernet for performance testing. It is possible to achieve higher efficiency using jumbo Ethernet frames. Jumbo frames minimize the per packet overhead and may produce a higher application throughput measurement. However, jumbo frames are not supported on many WAN connections.
Implications of PPPoE on Goodput Measurements
PPPoE requires an additional 8 bytes of header information. As a result, the UDP and TCP efficiency decreases when PPPoE is enabled on the WAN.
The UDP efficiency with PPPoE enabled is:
1,464 / 1,538 = .952 or 95.2% = UDP Efficiency
This results in a theoretical maximum application throughput for UDP of:
.952 * 1,000 = 952 Mb/sec = Maximum Application Throughput for UDP
Likewise, the TCP efficiency with PPPoE enabled is:
1,452 / 1,538 = .944 or 94.4% = TCP Efficiency
Which results in a theoretical maximum application throughput for TCP of:
.944 * 1,000 = 944 Mb/sec = Maximum Application Throughput for TCP
Implications of VLANs
Like PPPoE, VLANs impact the UDP and TCP efficiency due to the additional 4 bytes of header that are required.
The UDP efficiency with VLANs enabled is:
1,468 / 1,538 = .954 or 95.4% = UDP Efficiency
This results in a theoretical maximum application throughput for UDP of:
.954 * 1,000 = 954 Mb/sec = Maximum Application Throughput for UDP
Likewise, the TCP efficiency with VLANs enabled is:
1,456 / 1,538 = .947 or 94.7% = TCP Efficiency
Which results in a theoretical maximum application throughput for TCP of:
.947 * 1,000 = 947 Mb/sec = Maximum Application Throughput for TCP
Implications of IPv6
IPv6 uses 40-byte headers instead of 20-byte headers in IPv4. As a result, the UDP and TCP efficiency decreases when IPv6 is used.
1,518 - 18 (Ethernet frame) - 40 (IPv6 header) - 8 (UDP header) = 1,472 bytes
The UDP efficiency for IPv6:
1,452 / 1,538 = .944 or 94.4% = UDP Efficiency
This results in a theoretical maximum application throughput for UDP of:
.944 * 1,000 = 944 Mb/sec = Maximum Application Throughput for UDP
Likewise, the TCP efficiency over IPv6 is:
1,440 / 1,538 = .936 or 93.6% = TCP Efficiency
Which results in a theoretical maximum application throughput for TCP of:
.936 * 1,000 = 936 Mb/sec = Maximum Application Throughput for TCP
And these value are further impacted when PPPoE or VLANs are used with IPv6.
Understanding the Theoretical Maximum for Wireless Interfaces
Determining the theoretical maximum application goodput using wireless interface more complex due to the number of additional variables involved. Many of these variables are determined by the configuration of the DUT’s integrated access point, including:
- The band used: 2.4 GHz, 5.0 GHz, 6.0 GHz
- The channel width: 20, 40, 80 MHz, or 160 MHz
- The 802.11 mode supported: 802.11 a/b/g/n/ac/ax/be (including 802.11ac Wave 2)
- The number of spatial streams supported: 1 through 4
Other variables are environment specific and include the quality of the signal and the amount of interference or noise that is present. Environmental variables can be unpredictable and must be taken into consideration when reviewing performance results generated with wireless interfaces.
Hardware versions 3, 4, 5, 6-S, 6-10G, 7-S, and 7-10G of the NTA1000 platform are supported by the CDRouter Performance expansion. One of the major differences between these hardware versions is the type of network interface(s) installed:
| NTA1000 Version | QCA (N) | QCA (ACN) | QCA (AC2) | Intel (AX) | MediaTek (AX) Intel | 10GBASE-T Ethernet |
|---|---|---|---|---|---|---|
| v5 | Yes | Yes | No | No | No | No |
| v6-S | Yes | Yes | Yes | No | No | No |
| v6-10G | No | Yes | Yes | No | No | No |
| v7-S | No | Yes | Yes | Yes | No | No |
| v7-10G | No | Yes | No | Yes | No | Yes |
| v7M-S | No | Yes | Yes | No | Yes | No |
| v7M-10G | No | Yes | No | No | Yes | Yes |
The QCA based adapter found in the NTA1000v4, v5, and v6 platforms is a dual-band 3x3 design that supports 802.11 a/b/g/n. Likewise, the Intel based adapter found in the NTA1000v4 platforms is a dual-band 2x2 design that supports 802.11 a/b/g/n/ac.
The NTA1000v5 replaced the Intel adapter with a QCA 802.11 ac capable 3x3 design. The NTA1000v6-S adds a third QCA 802.11 ac Wave 2 capable 4x4 design (5GHz band only). The NTA1000v6-10G replaces the QCA n adapter with a dual port 10GBASE-T Ethernet NIC capable of 2.5 / 5 / 10 Gbps speeds.
The NTA1000v7-S replaces the QCA n adapter in the NTA1000v6-S with an 2x2 dual-band 802.11 ax capable Intel adapter. The NTA1000v7-10G replaces the QCA ac Wave 2 adapter in the NTA1000v6-10G with the same Intel ax adapter.
The maximum theoretical physical layer data rates supported by these wireless adapters for each band is shown below:
| Wireless Adapter | Band | MCS Index | Spatial Streams | Maximum Physical Layer Data Rate |
|---|---|---|---|---|
| QCA (N) | 2.4 GHz | HT 23 | 3x3 | 450 Mbps |
| QCA (N) | 5.0 GHz | HT 23 | 3x3 | 450 Mbps |
| QCA (ACN) | 2.4 GHz | HT 23 | 3x3 | 450 Mbps |
| QCA (ACN) | 5.0 GHz | VHT 9 | 3x3 | 1300 Mbps |
| QCA (AC2) | 5.0 GHz | VHT 9 | 4x4 | 1733.33 Mbps |
| Intel (AX) | 2.4 GHz | HE 11 | 2x2 | Up to 573.5 Mbps |
| Intel (AX) | 5.0 GHz | HE 11 | 2x2 | Up to 2402 Mbps |
| MediaTek (AX) | 2.4 GHz | HE 11 | 2x2 | Up to 573.5 Mbps |
| MediaTek (AX) | 5.0 GHz | HE 11 | 4x4 | Up to 2402 Mbps (4x4 @ 80 MHz) |
These maximum data rates represent connections in ideal environments with the maximum channel width, highest modulation, shortest guard interval, and all spatial streams enabled.
In practice, every wireless frame that is transmitted must be acknowledged, which has a significant impact on the maximum application throughput that may be achieved. Of course, there are techniques to bundle several frames together to get a larger PDU that helps reduce the number of acknowledgments needed. In addition, the UDP and TCP efficiency must be factored in which results in maximum application throughput figures that are often no more than 50 to 60% of the maximum physical layer data rates presented above:
| Wireless Adapter | Band | Approximate Maximum Application Throughput |
|---|---|---|
| QCA (N) | 2.4 GHz | 225 to 270 Mbps |
| QCA (N) | 5.0 GHz | 225 to 270 Mbps |
| QCA (ACN) | 2.4 GHz | 225 to 270 Mbps |
| QCA (ACN) | 5.0 GHz | 650 to 780 Mbps |
| QCA (AC2) | 5.0 GHz | 867 to 1040 Mbps |
| Intel (AX) | 2.4 GHz | 286 to 344 Mbps |
| Intel (AX) | 5.0 GHz | 1200 to 1450 Mbps |
| MediaTek (AX) | 2.4 GHz | 286 to 344 Mbps |
| MediaTek (AX) | 5.0 GHz | 1200 to 1450 Mbps |
It is important to note that these are approximate values that pertain to the capabilities of the NTA1000 platforms from QA Cafe. These values should only be used as a guideline. Results will vary from one test setup to another and are highly sensitive to the both the wireless environment and the device configuration.
Pass/Fail Criteria
Each performance test generates a PASS or FAIL test result, based on configurable ranges for each performance metric that is measured. If the measured performance for a particular metric falls outside of the acceptable threshold(s), CDRouter will fail the test. Likewise, if the measured performance falls within the acceptable threshold(s), CDRouter will pass the test.
The thresholds for each performance metric can be found in WAN Download Thresholds, WAN Upload Thresholds, LAN to LAN Thresholds, and Application Thresholds sections within the CDRouter Performance Expansion portion of the CDRouter configuration file. Default values have been chosen for all thresholds.
Performance Graphs
One of the features of the CDRouter Performance expansion is the ability to generate graphs of device performance. These graphs make it very easy to verify that the DUT’s performance for key metrics is consistent over time when measured across multiple iterations of a test run. Discrepancies between key performance metrics and performance degradation due to functional testing included in the test run will also be easy to identify.
For multi-client performance tests the total aggregate performance of all LAN clients is graphed.
Applicable Test Cases
The tables below list the tests that automatically collect bandwidth and latency test metrics that CDRouter uses to generate performance graphs.
| Test Case | Description | Metric Name |
|---|---|---|
| perf_1 | IPv4 TCP download throughput test WAN to LAN | bandwidth |
| perf_2 | IPv4 TCP upload throughput test LAN to WAN | bandwidth |
| perf_3 | IPv4 UDP download throughput test WAN to LAN | bandwidth |
| perf_4 | IPv4 UDP upload throughput test LAN to WAN | bandwidth |
| perf_5 | IPv4 TCP bidirectional throughput test | bandwidth |
| perf_6 | IPv4 UDP bidirectional throughput test | bandwidth |
| perf_7 | IPv4 UDP download loss threshold test WAN to LAN | bandwidth |
| perf_8 | IPv4 UDP upload loss threshold test LAN to WAN | bandwidth |
| perf_9 | IPv4 bidirectional latency test | latency |
| perf_10 | IPv4 DHCP renew latency test | latency |
| perf_11 | IPv4 DHCP restart latency test | latency |
| perf_12 | IPv4 DNS query latency test | latency |
| perf_lan_1 | IPv4 TCP ‘download’ throughput test LAN to LAN | bandwidth |
| perf_lan_2 | IPv4 TCP ‘upload’ throughput test LAN to LAN | bandwidth |
| perf_lan_3 | IPv4 UDP ‘download’ throughput test LAN to LAN | bandwidth |
| perf_lan_4 | IPv4 UDP ‘upload’ throughput test LAN to LAN | bandwidth |
| perf_lan_5 | IPv4 TCP bidirectional throughput test LAN to LAN | bandwidth |
| perf_lan_6 | IPv4 UDP bidirectional throughput test LAN to LAN | bandwidth |
| perf_lan_7 | IPv4 UDP ‘download’ loss threshold test LAN to LAN | bandwidth |
| perf_lan_8 | IPv4 UDP ‘upload’ loss threshold LAN to LAN | bandwidth |
| perf_lan_9 | IPv4 bidirectional latency test LAN to LAN | latency |
| perf_mcast_1 | IPv4 Multicast UDP download throughput test WAN to LAN | bandwidth |
| perf_mcast_2 | IPv4 Multicast UDP upload throughput test LAN to WAN | bandwidth |
| perf_mcast_lan_1 | IPv4 UDP Multicast ‘download’ throughput test LAN to LAN | bandwidth |
| perf_mcast_lan_2 | IPv4 UDP Multicast ‘upload’ throughput test LAN to LAN | bandwidth |
| perf_multi_1 | Multiple clients IPv4 TCP download throughput test WAN to LAN | bandwidth |
| perf_multi_2 | Multiple clients IPv4 TCP upload throughput test LAN to WAN | bandwidth |
| perf_multi_3 | Multiple clients IPv4 UDP download throughput test WAN to LAN | bandwidth |
| perf_multi_4 | Multiple clients IPv4 UDP upload throughput test LAN to WAN | bandwidth |
| Test Case | Description | Metric Name |
|---|---|---|
| ipv6_perf_1 | IPv6 TCP download throughput test WAN to LAN | bandwidth |
| ipv6_perf_2 | IPv6 TCP upload throughput test LAN to WAN | bandwidth |
| ipv6_perf_3 | IPv6 UDP download throughput test WAN to LAN | bandwidth |
| ipv6_perf_4 | IPv6 UDP upload throughput test LAN to WAN | bandwidth |
| ipv6_perf_5 | IPv6 TCP bidirectional throughput test | bandwidth |
| ipv6_perf_6 | IPv6 UDP bidirectional throughput test | bandwidth |
| ipv6_perf_7 | IPv6 UDP download loss threshold test WAN to LAN | bandwidth |
| ipv6_perf_8 | IPv6 UDP upload loss threshold test LAN to WAN | bandwidth |
| ipv6_perf_9 | IPv6 bidirectional latency test | latency |
| ipv6_perf_10 | IPv6 DHCPv6 renew latency test | latency |
| ipv6_perf_11 | IPv6 DHCPv6 restart latency test | latency |
| ipv6_perf_12 | IPv6 DNS query latency test | latency |
| ipv6_perf_lan_1 | IPv6 TCP ‘download’ throughput test LAN to LAN | bandwidth |
| ipv6_perf_lan_2 | IPv6 TCP ‘upload’ throughput test LAN to LAN | bandwidth |
| ipv6_perf_lan_3 | IPv6 UDP ‘download’ throughput test LAN to LAN | bandwidth |
| ipv6_perf_lan_4 | IPv6 UDP ‘upload’ throughput test LAN to LAN | bandwidth |
| ipv6_perf_lan_5 | IPv6 TCP bidirectional throughput test LAN to LAN | bandwidth |
| ipv6_perf_lan_6 | IPv6 UDP bidirectional throughput test LAN to LAN | bandwidth |
| ipv6_perf_lan_7 | IPv6 UDP ‘download’ loss threshold test LAN to LAN | bandwidth |
| ipv6_perf_lan_8 | IPv6 UDP ‘upload’ loss threshold LAN to LAN | bandwidth |
| ipv6_perf_lan_9 | IPv6 bidirectional latency test LAN to LAN | latency |
| ipv6_perf_mcast_1 | IPv6 Multicast UDP download throughput test WAN to LAN | bandwidth |
| ipv6_perf_mcast_2 | IPv6 Multicast UDP upload throughput test LAN to WAN | bandwidth |
| ipv6_perf_mcast_lan_1 | IPv6 Multicast UDP ‘download’ throughput test LAN to LAN | bandwidth |
| ipv6_perf_mcast_lan_2 | IPv6 Multicast UDP ‘upload’ throughput test LAN to LAN | bandwidth |
| ipv6_perf_multi_1 | Multiple clients IPv6 TCP download throughput test WAN to LAN | bandwidth |
| ipv6_perf_multi_2 | Multiple clients IPv6 TCP upload throughput test LAN to WAN | bandwidth |
| ipv6_perf_multi_3 | Multiple clients IPv6 UDP download throughput test WAN to LAN | bandwidth |
| ipv6_perf_multi_4 | Multiple clients IPv6 UDP upload throughput test LAN to WAN | bandwidth |
The tables below list the tests that automatically collect client_bandwidth test metrics that CDRouter uses to generate performance graphs.
| Test Case | Description | Metric Name |
|---|---|---|
| perf_multi_1 | Multiple clients IPv4 TCP download throughput test WAN to LAN | client_bandwidth |
| perf_multi_2 | Multiple clients IPv4 TCP upload throughput test LAN to WAN | client_bandwidth |
| perf_multi_3 | Multiple clients IPv4 UDP download throughput test WAN to LAN | client_bandwidth |
| perf_multi_4 | Multiple clients IPv4 UDP upload throughput test LAN to WAN | client_bandwidth |
| Test Case | Description | Metric Name |
|---|---|---|
| ipv6_perf_multi_1 | Multiple clients IPv6 TCP download throughput test WAN to LAN | client_bandwidth |
| ipv6_perf_multi_2 | Multiple clients IPv6 TCP upload throughput test LAN to WAN | client_bandwidth |
| ipv6_perf_multi_3 | Multiple clients IPv6 UDP download throughput test WAN to LAN | client_bandwidth |
| ipv6_perf_multi_4 | Multiple clients IPv6 UDP upload throughput test LAN to WAN | client_bandwidth |
The test cases which produce metrics for Range vs Rate graphs are detailed in the
Wi-Fi RvR User Guide.
These all produce metrics with the metric name "rvr".
Creating Graphs
Every time a supported test case is is executed CDRouter will log the final performance metric (bandwidth or latency) that was achieved by the DUT. These data points can then be graphed using either the Visualize Performance or the Visualize Latency features included with CDRouter’s Visualize tool.
All of the data points for each supported performance test case within a single test run are plotted as a separate time series on the performance graph. As a result, the best way to build a meaningful performance graph is to utilize CDRouter’s looping and repeating features to ensure that multiple data points are collected for each performance test case within the same test run.
Performance graphs are interactive, and all available performance data for the selected test run is displayed by default. Individual series can be removed from the graph by clicking on them in the legend. Likewise, clicking on an individual data point within the graph will automatically load the log file for that particular test case.
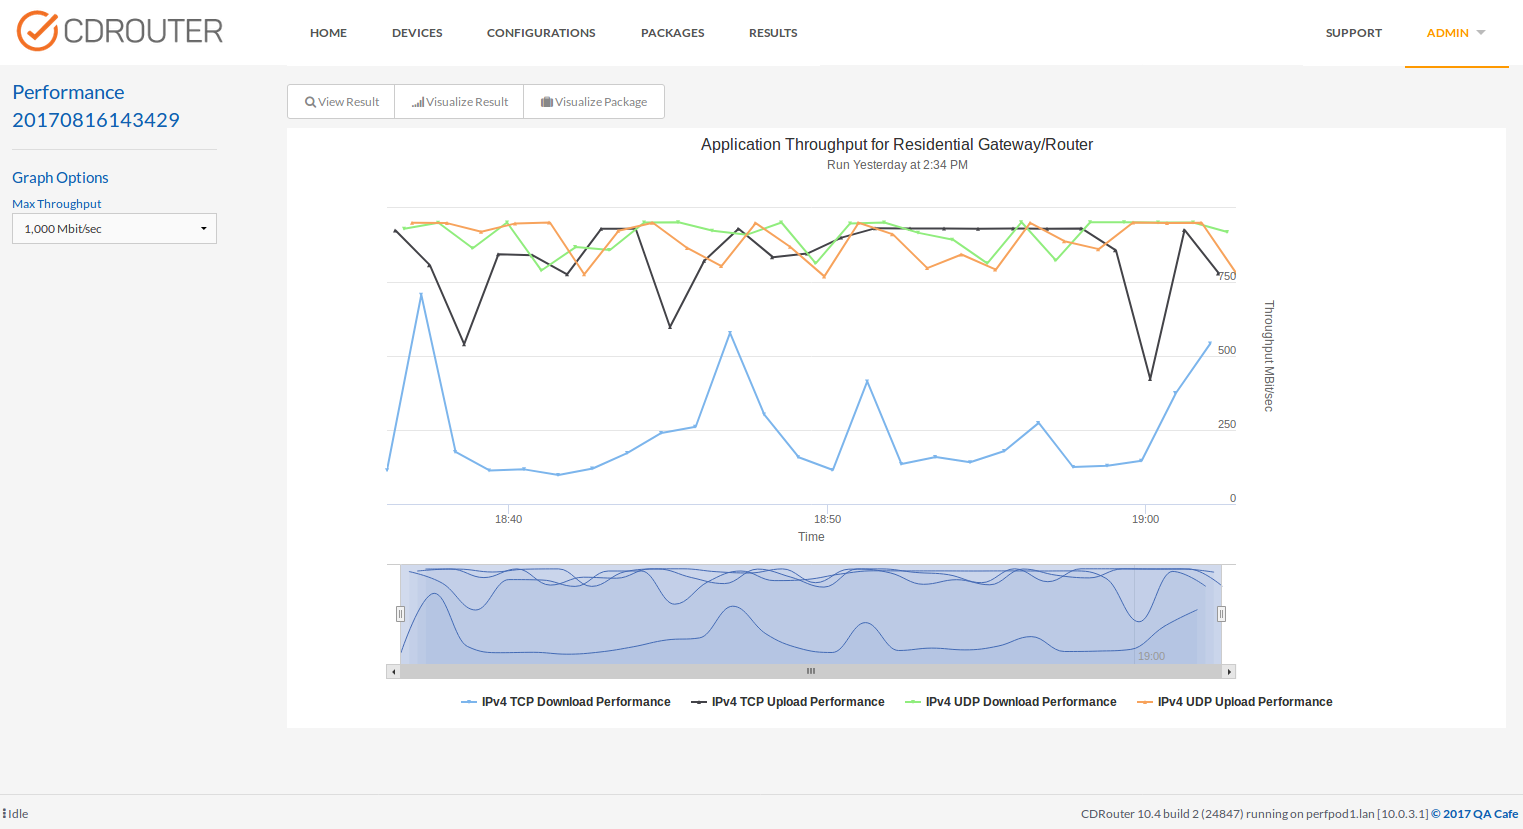
Here is an example performance graph showing UDP and TCP throughput for IPv4.
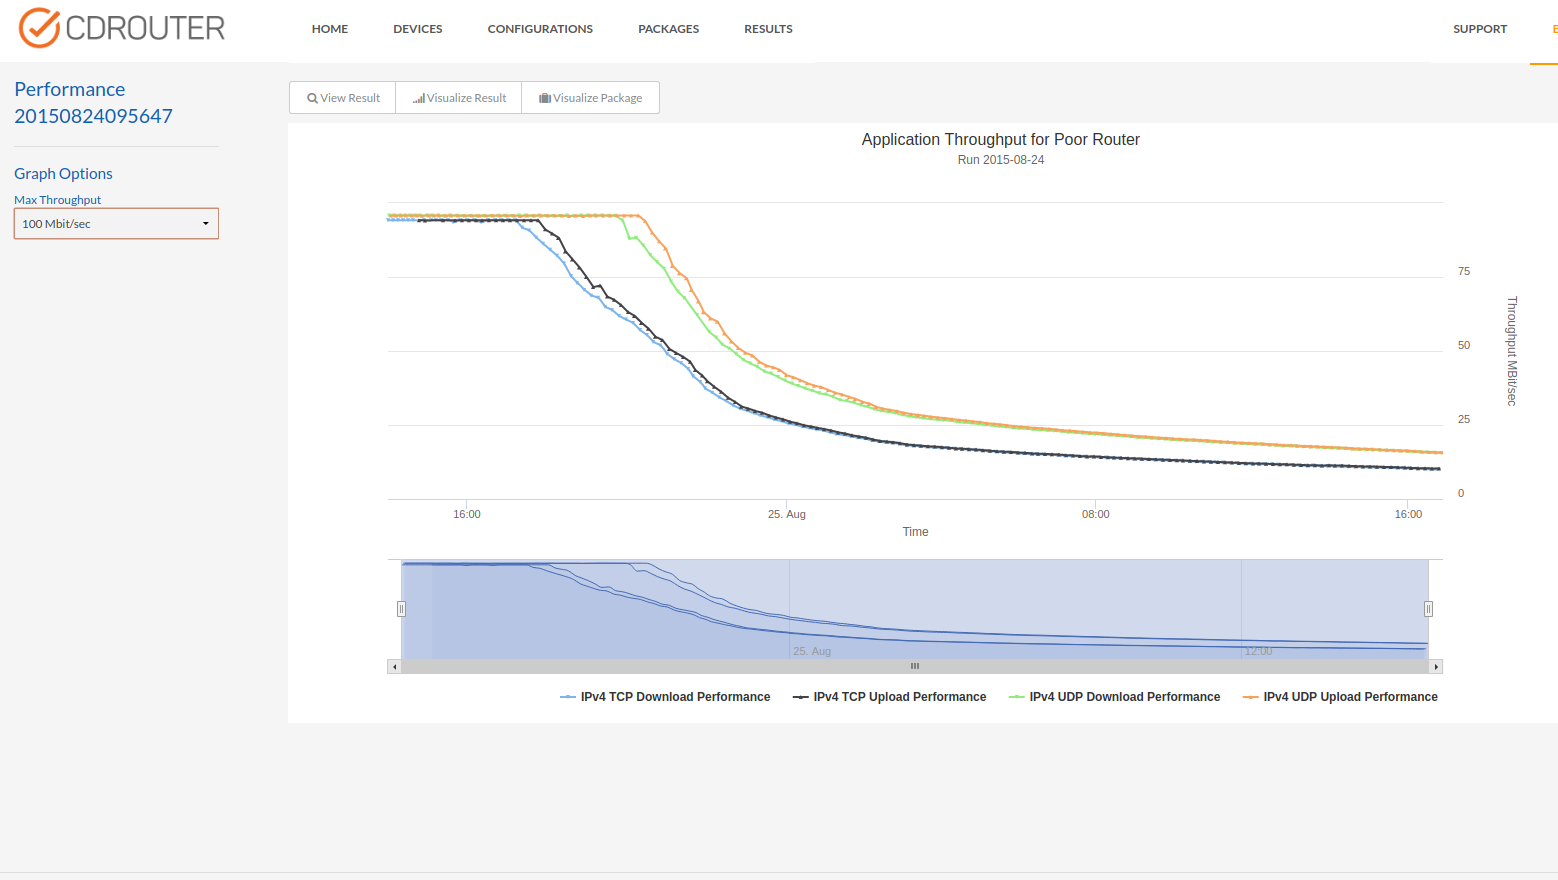
This graph below shows significant degradation for all throughput metrics over time. These results were achieved by mixing performance throughput and functional tests in the same test run. It should be noted that this same device did not exhibit performance degradation unless certain functional tests are included in the test run.
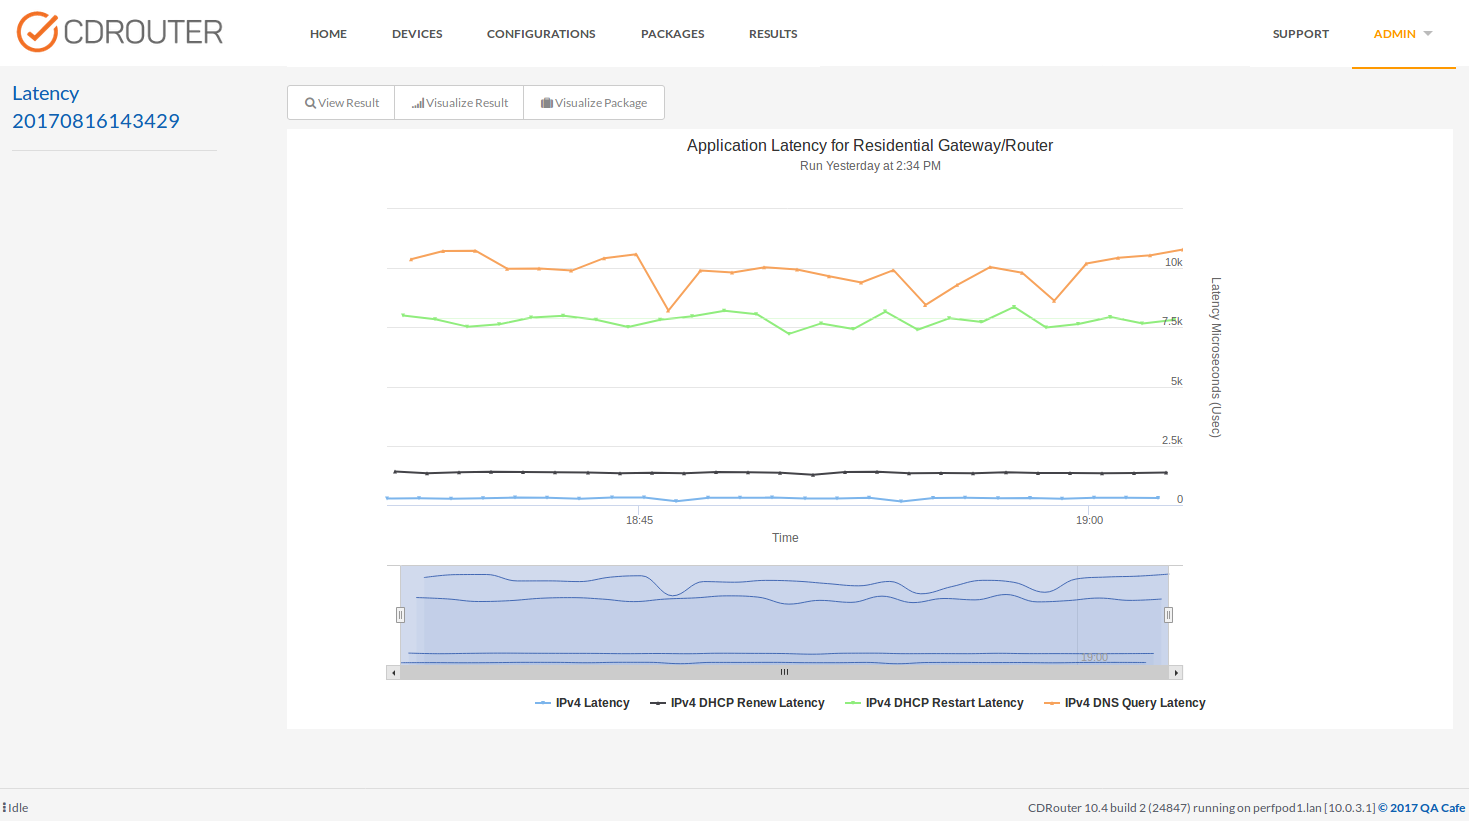
This graph shows the IPv4 application latency for UDP, DHCP and DNS when run against a particular DUT.
Performance Testing Considerations
TR-069
CDRouter’s TCP offload interface should be used for the ACS in any
configurations where both TR-069 and performance are enabled. The TCP offload
interface is disabled by default, and can be explicitly enabled by configuring
the acsUseTcpOffload to a value of “yes”.
testvar acsUseTcpOffload yes
Disparate Network Interface Speeds
Packet loss may occur when testing a DUT with different network interface speeds on the WAN and LAN. This is especially true for UDP performance tests since UDP does not have any ability to adapt to available bandwidth, unlike TCP.
Some common examples are testing download speeds from a Gigabit Ethernet WAN to slower 802.11 wifi LAN interfaces. If realistic bandwidth targets are not set, CDRouter will send UDP traffic at gigabit speeds on the WAN, which will result in significant packet loss on the LAN. Likewise, DSL and DOCSIS gateways may have slower WAN speeds and therefore suffer from the same problem during upload tests.
To combat this issue, reasonable bandwidth targets for both upstream and
downstream testing should be set using the testvars perfUploadBandwidth
and perfDownloadBandwidth, respectively.
Note that some experimentation may be required to determine acceptable bandwidth targets for a particular test setup and configuration.
Examining Raw Data
CDRouter’s Performance modules use a variety of different methods to collect and process performance data. How the data is collected and used for reporting results varies depending on the type of test, number of interfaces, and the metrics being collected. For this reason, it is highly recommended to leverage data reported by CDRouter.
However, there are times where more data can be helpful to add context to testing, debug a tough issue, or to validate results collection. For this reason CDRouter performance tests that utilize iperf include the raw data generated by iperf in JSON format, for each client and server used during the test.
The contents of the JSON files are not viewable from the CDRouter Web UI, however they can be accessed and downloaded by navigating to the Log Directory for a given result, or via the Web API.
The JSON data files are named according to the following format:
<LOGDIR>/<TestName>_iperf_[client/server]_<InterfaceName>_<TestPort>_results<TestIndex>.json
For Example:
ipv6_perf_1_iperf_client_lan_19750_results.1.json
ipv6_perf_1_iperf_server_wan_19750_results.1.json
Testing Exercises
Analyze Performance Over Time
A great testing exercise is to monitor the performance of a DUT over time by creating a test package with a mix of performance and functional test cases and looping it.
Looping the test package will generate meaningful performance graphs that highlight the DUT’s performance over time. Adding functional tests to the package make it possible to verify whether or not various protocol interactions have an impact on the performance of the DUT.
Looping performance tests alone is a good way to generate baseline measurements. Any discrepancies between TCP and UDP, IPv4 and IPv6, or upload and download performance will be easy to spot.
Validate QoS Settings
CDRouter Performance makes it possible to validate QoS settings if the DUT has the ability to throttle data traffic based on IP address, transport protocol, or port number.
Many of the performance metrics measured by CDRouter have associated “high” thresholds that can be configured. Enabling and setting these thresholds based on specific QoS policies in the DUT make it possible to verify that the DUT’s QoS policy is actually working as expected.
Mix Performance and Functional Tests
Performance tests can be added to any existing CDRouter test package. Running performance tests alone is a good way to generate baseline measurements. Mixing performance and functional tests together and looping the test package is a great way to identify performance degradation over time due to protocol interactions. DHCP, DNS, NAT, and many other protocols can have an impact on performance. With CDRouter Performance it is easy to identify these trends.
Our testing has identified a few interesting performance issues using this technique. In one case a DUT’s performance was stable and consistent when only performance tests were run. However, when a few simple functional tests were added to the same package, significant performance degradation was witnessed after only a few hours of testing. This particular DUT seemed to be especially sensitive to DHCP client interactions on its WAN interface.
Packet Capture and Performance
CDRouter disables packet captures for performance traffic by default.
Performance traffic is not displayed in the main log file or interface capture
files. It is possible to enable capture files for performance traffic by setting
the testvar perfEnableCapture to “yes”.
testvar perfEnableCapture yes
Enabling performance captures also has a slight impact on the performance
capabilities of the NTA1000 and will produce large capture files that are not
easily viewed. A short performance duration is recommended if capture files are
enabled. Alternatively, the perfEnableCapture may be set to a
value of “control” which will filter and capture only TCP session setup and ICMP
traffic. The control capture option greatly reduces the overall size of the
capture file making it suitable for viewing within CDRouter’s web interface.
Control traffic is useful in some cases for debugging performance tests.
Note that performance results with captures enabled may be difficult to export from CDRouter’s web interface since the capture files are part of the export. It is also possible to quickly fill the disk on the system by running with capture files enabled for an extended period of time.
For example, a single 10 second performance test with packet captures disabled uses approximately 130KB of disk space. The same 10 second test with control capture enabled used 135KB. However, the same 10 second test with full capture enabled used 315MB.
Limitations
-
As mentioned in the Test Setup section, CDRouter Performance currently supports a limited number of WAN modes. Specifically static, DHCP and PPPoE for IPv4, and static, autoconf, DHCPv6, DHCPv6 w/PD, and PPPoE for IPv6.
-
CDRouter Performance is able to drive line rate bandwidth on a 1 Gigabit Ethernet interface using 1500 byte IPv4/v6 packets. For UDP traffic, the total bandwidth generated by the NTA1000 will drop if small packets/frames are configured. The NTA1000 cannot drive line rate 1 Gigabit bandwidth using 64 byte packets with a single client. To achieve line rate with UDP using a 10 Gbps interface, multiple clients or jumbo frames (larger than 1500 byte MTU) will be necessary. Use
jumboMtuin conjunction withperfUdpLento adjust the size of UDP packets larger than 1500 bytes. -
Limitations for bi-directional testing -
- NTA1000 platforms - the total bandwidth of the system is approximately 10.5 Gb/sec.
- NTA3000 platforms - the total bandwidth of the system is approximately
19 Gb/sec. (caveat - you will need to use multiple streams (
perfStreams4) to generate enough data traffic)
-
Due to a known limitation with the MediaTek 802.11ax adapter installed in the NTA1000v7M-S and NTA1000v7M-10G, support for four spatial streams is limited to 80 MHz or narrower channels only. A maximum of two spatial streams are supported for 160 MHz channel widths. For best performance with this adapter 80 MHz or narrower channels should be used and OFDMA should be disabled on the DUT when testing with multiple LAN clients. Due to the same limitation, CDRouter is not compatible with ‘auto’ bandwidth mode for 802.11ac if 160 MHz is an option that the AP could select; we recommend using 20/40/80 instead for 802.11 ac mode to avoid this issue.